Inflation risks rise as oil soars and US agricultural workers leave
Markets faced a series of challenges in October but still surged to new highs. The US government was shut down for the month, with the Congressional Budget Office estimating the cost at $18 billion. The US regional banking sector experienced heightened turmoil as Zions Bancorp and Western Alliance share prices plunged on substantial loan impairments and fraud, drawing parallels to the Silicon Valley Bank collapse of 2023. Markets also whipsawed on developments in the US-China trade conflict, where Beijing tightened rare earth export restrictions and President Trump subsequently threatened an additional 100% tariff on Chinese imports. Following this announcement on 10 October, the crypto market experienced the largest liquidation event in its history, wiping out over $19 billion across 1.6 million traders. Bitcoin fell sharply from $125 000 to a low of $102 000, most likely magnified by holders of perpetual futures being forced to liquidate. US equities fell 3.5%, but traditional safe havens rallied, including gold, US bonds, the US dollar and the Japanese yen.
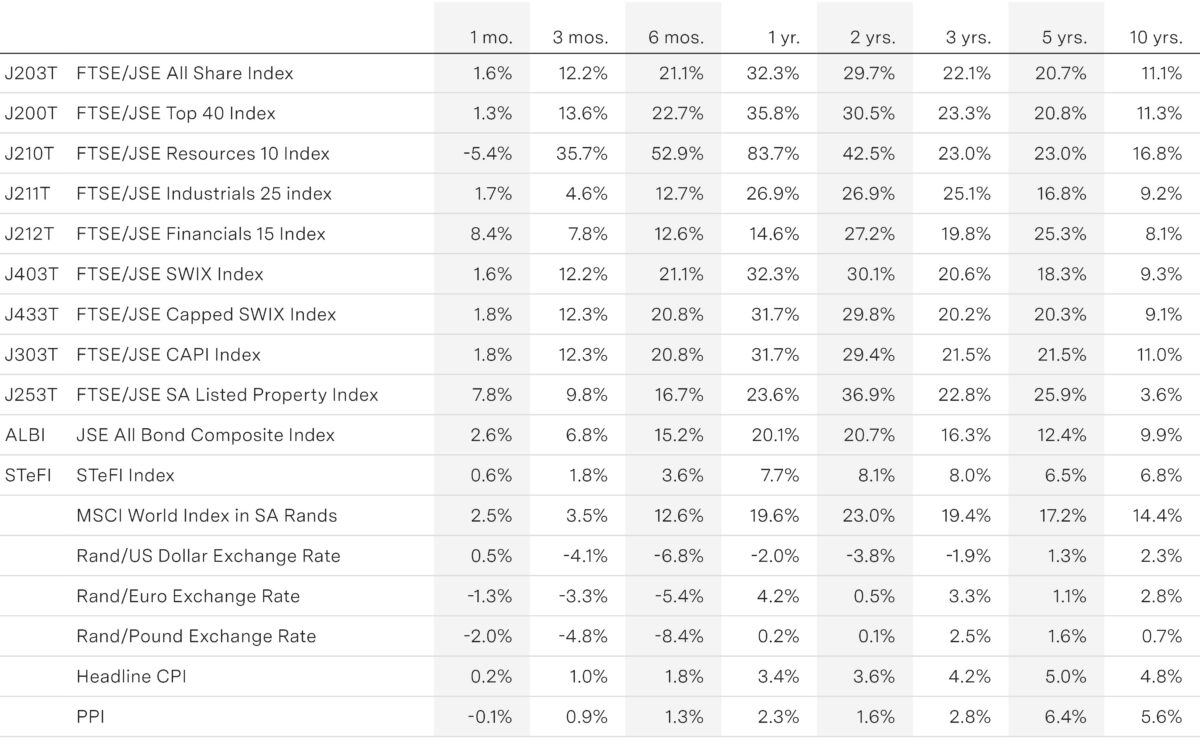
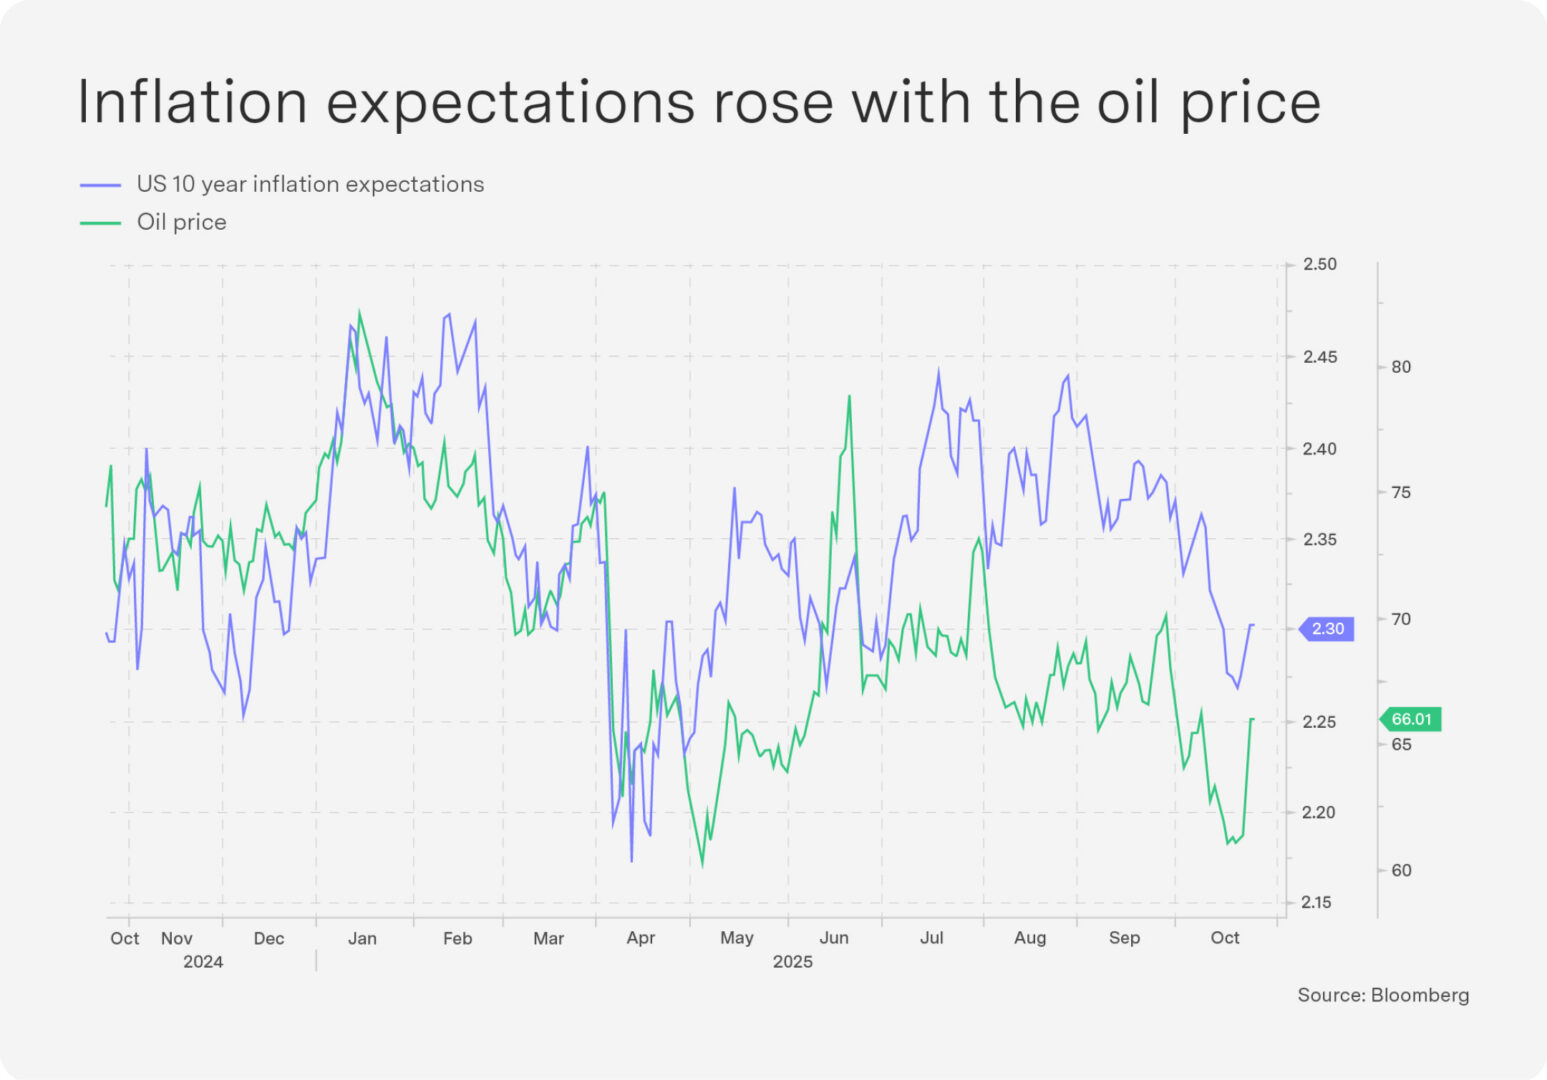
Oil jumped 5% after the US announced sanctions on Russia for the first time since Trump’s return to the White House. On the same day, the European Union (EU) agreed on a 19th sanctions package against Moscow that will ban imports of Russian liquified natural gas (LNG) from 2027 – its first-ever ban on Russian LNG imports. The package includes a full transaction ban on two major Russian oil companies, Rosneft PJSC and Gazpromneft, and puts an additional 117 vessels from the “shadow fleet” on the sanctions blacklist. Oil prices rallied further after Trump confirmed the US had cancelled all trade negotiations with Canada, a major source of oil for the US. The rising oil price adds pressure to inflation risks (see Chart 1). While headline inflation came in below expectations for September at 3%, supercore inflation, or core services less housing, ticked up, remaining close to 0.4% for a third consecutive month.
In addition to oil price and tariff risks to inflation, a recent Department of Labour report suggests that 42% of agricultural workers may be unable to enter the US because they would be subject to removal by Immigration and Customs Enforcement (ICE) or would leave the workforce. Food prices could thus rise much faster than their current elevated rate of 3.2%. The supply shock could be extensive, as immigration rules are unlikely to change under Trump. Food inflation has a significant effect on consumer inflation expectations – a closely watched measure by the Fed. As expected, the Fed cut interest rates by 25 bps to the 3.75–4% range, but Fed Chair Jerome Powell stated that a December cut was not guaranteed. “A further reduction in the policy rate at the December meeting is not a foregone conclusion,” Powell said. “Far from it.”
South Africa’s changing inflation dynamics

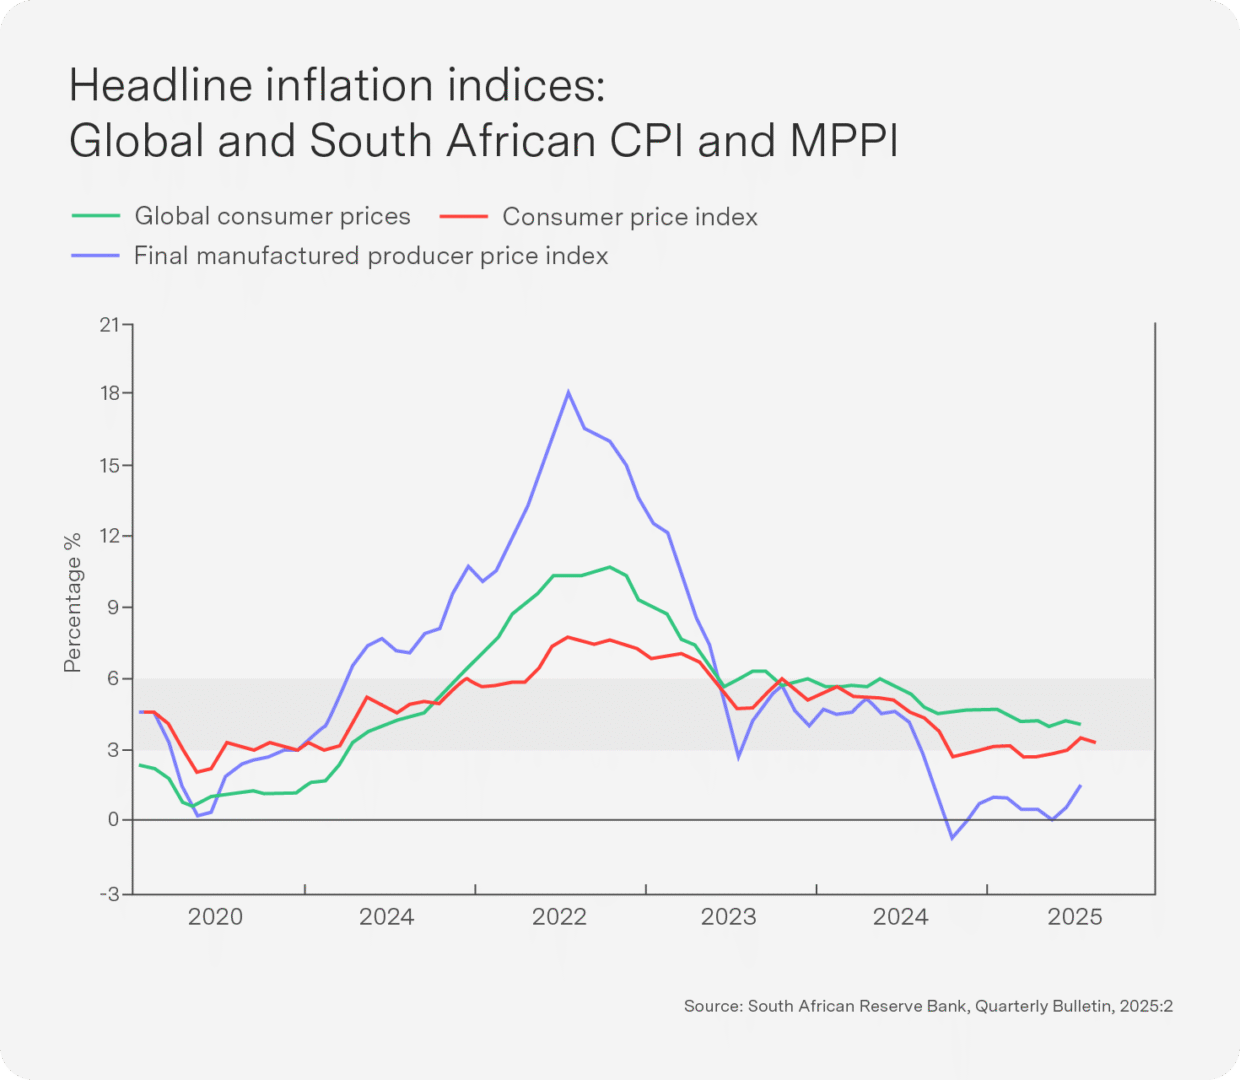
The recent change in South Africa’s inflationary environment is in part thanks to the ultra-hawkish approach of the South African Reserve Bank, putting us comfortably in the inflation-targeted range of 3–6%. In fact, at about 3.5%, we are close to the lower threshold. This headline consumer inflation number has moderated markedly since its 2022 peak, when we hit close to double-digit inflation amidst global energy and food shocks caused by the Covid-19 pandemic. In this respect, South Africa’s price landscape has undergone a distinct transition from the volatility of the pandemic and post-war era to the narrower and more subdued inflation of the 2020–2025 period. Both consumer and producer price indices have shown clear disinflationary momentum, even as price pressures have persisted in key domestic sectors such as food, housing and utilities (see graphic below). There was an even sharper deceleration in producer price inflation for final manufactured goods, stabilising around 1.5% by mid-2025.
These declines do, however, mask outlier price pressures on both producers and consumers. Despite the notable decline in energy’s contribution to overall supplier inflation, agriculture and other intermediate goods prices were higher than the overall producer price index. Consumer price inflation was particularly high in meat products, rising from -0.5% in January to 11.3% in August, and in vegetables, where inflation peaked at close to 15% in July. The lesson here is crucial: While average inflation levels may be muted (as they currently are), they mask underlying deviations from the trend. So households with baskets disproportionately high in inflation items (meat, vegetables – or even health insurance or school fees) experience higher inflation rates. In high food price periods, we have shown over the years that poorer households have higher inflation rates than richer households, while middle class households may struggle more during periods of high energy or housing price inflation. Household-level inflation dynamics are important, and misreading their dynamics can be the difference between winning or losing an election.
The composition of inflationary pressures shifted significantly in the 2020–2025 period. Between 2020 and 2022, inflation was largely imported and supply-driven as global energy costs, shipping constraints and war-related food shortages drove prices up. The pandemic and the war in Ukraine were in full effect and global supply chains shaped and determined price movements in South Africa and most other small, open economies. Oil was the usual culprit driving local price increases. As the pandemic eased in 2023, these external pressures began to recede, and the inflation impulse turned inward. Domestic factors, particularly in food and administered (Eskom and electricity) prices became the dominant drivers as weather patterns created supply shortages and disease outbreaks in livestock, and inefficiencies in supply logistics continued. Weather shocks are likely to be an ongoing feature of our inflation dynamic. Services inflation, including housing, health and communications, hovered around 3–4%, reflecting subdued wage growth and weak household demand.
Low growth momentum has ensured that services price pressures are relatively under control for now (unlike the pre-2008 period, when the economy recorded double-digit services inflation under higher growth rates).
The new consumer inflation narrative is thus ultimately not one of broad-based overheating but of sectoral bottlenecks and climate-related supply shocks that feed through to consumer prices with uneven intensity. This does not mean that global supply shocks are gone forever, of course, but it is clear that over the last two years at least, our inflation dynamics have been highly localised in nature and driven by controllable (logistics bottlenecks, administered prices, disease outbreaks) and uncontrollable factors (weather shocks).
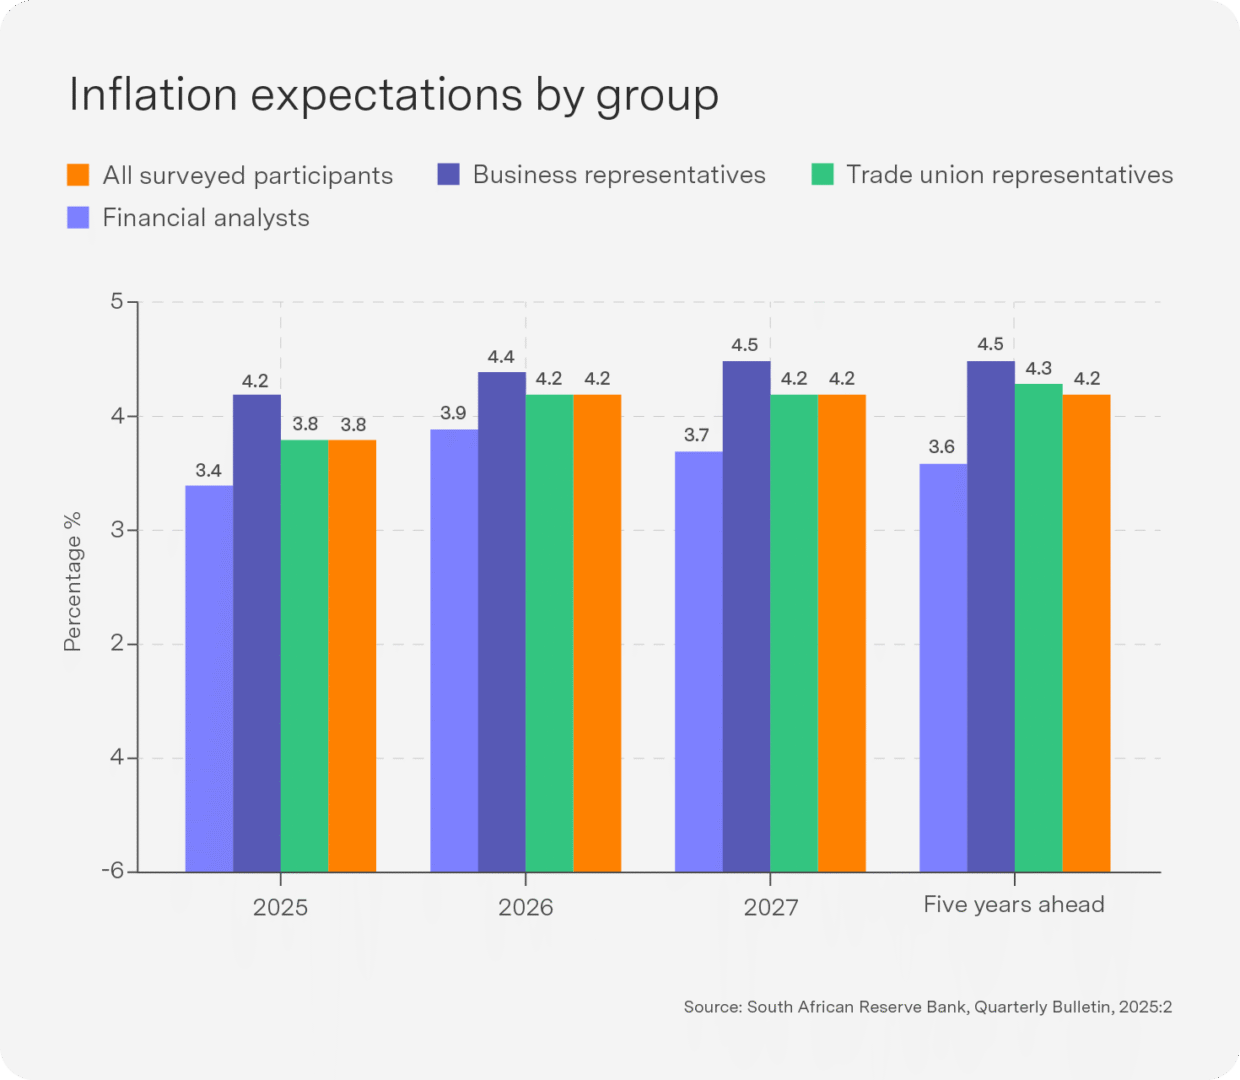
Perhaps most crucial for monetary policy, however, are inflation expectations, a critical determinant of long-term price stability and arguably the bedrock of modern monetary policy. The South African data below show that expectations of key economic actors have shifted decisively downward. Average five-year-ahead expectations fell to 4.2% by mid-2025, their lowest point since 2011. Short-term expectations among financial analysts dropped even further, to 3.4% for 2025 and 3.9% for 2026 – compared to the expectations of businesses, at slightly above 4%. This convergence at the lower half of the target range signals a high degree of policy credibility for the SARB and reflects consistent communication around its anti-inflation stance.
The moderate inflationary expectations outlook is wholly positive for markets, growth and welfare, but the question remains as to whether formally driving inflation down through a lower inflation band (as I argued in a previous Sygnals) is worth the growth trade-off. With core inflation at 3.1% and administered price growth subdued, real policy rates remain positive and are arguably restrictive. Is maintaining such conservatism appropriate in a context of weak growth, low core inflation and limited demand pressure? The SARB’s preference for inflation near the bottom of the band may be constraining the recovery of private investment and consumption in an already fragile economy.
Top-performing Sygnia funds

South African property stocks rallied over one month on lower bond yields as foreigners returned to the SA bond market. Healthcare stocks rallied into the top five in October on the back of the announcement of a tariff exemption for branded drug manufacturers investing in the US; AI merger and acquisition excitement drove the other top contenders. NVIDIA became the first stock in the world to top $5 trillion in value, driving FANG and 4th IR funds higher, while EM technology stocks drove MSCI EM.
1-month absolute performance as at 30 0ctober 2025
1. Sygnia Itrix MSCI Emerging Markets 50 ETF 7.1%
2. Sygnia FANG.AI Equity Fund 6.3%
3. Sygnia 4th Industrial Revolution Global Equity Fund 5.7%
4. Sygnia Listed Property Index Fund 5.7%
5. Sygnia Health Innovation Global Equity Fund 4.8%
Gold and technology continued to buoy markets over one year, and South African equities benefitted from both Chinese technology and precious metal share exposure. Driven by US technology stocks, FANG.AI is in second place, EM rose to top position driven by EM technology exposure.
12-month absolute performance as at 30 October 2025
1. Sygnia Itrix MSCI Emerging Markets 50 ETF 38.6%
2. Sygnia Itrix FANG.AI Actively Managed ETF 38.3%
3. Sygnia FANG.AI Equity Fund 36.7%
4. Sygnia Itrix Top 40 ETF 35.9%
5. Sygnia Top 40 Index Fund 31.7%
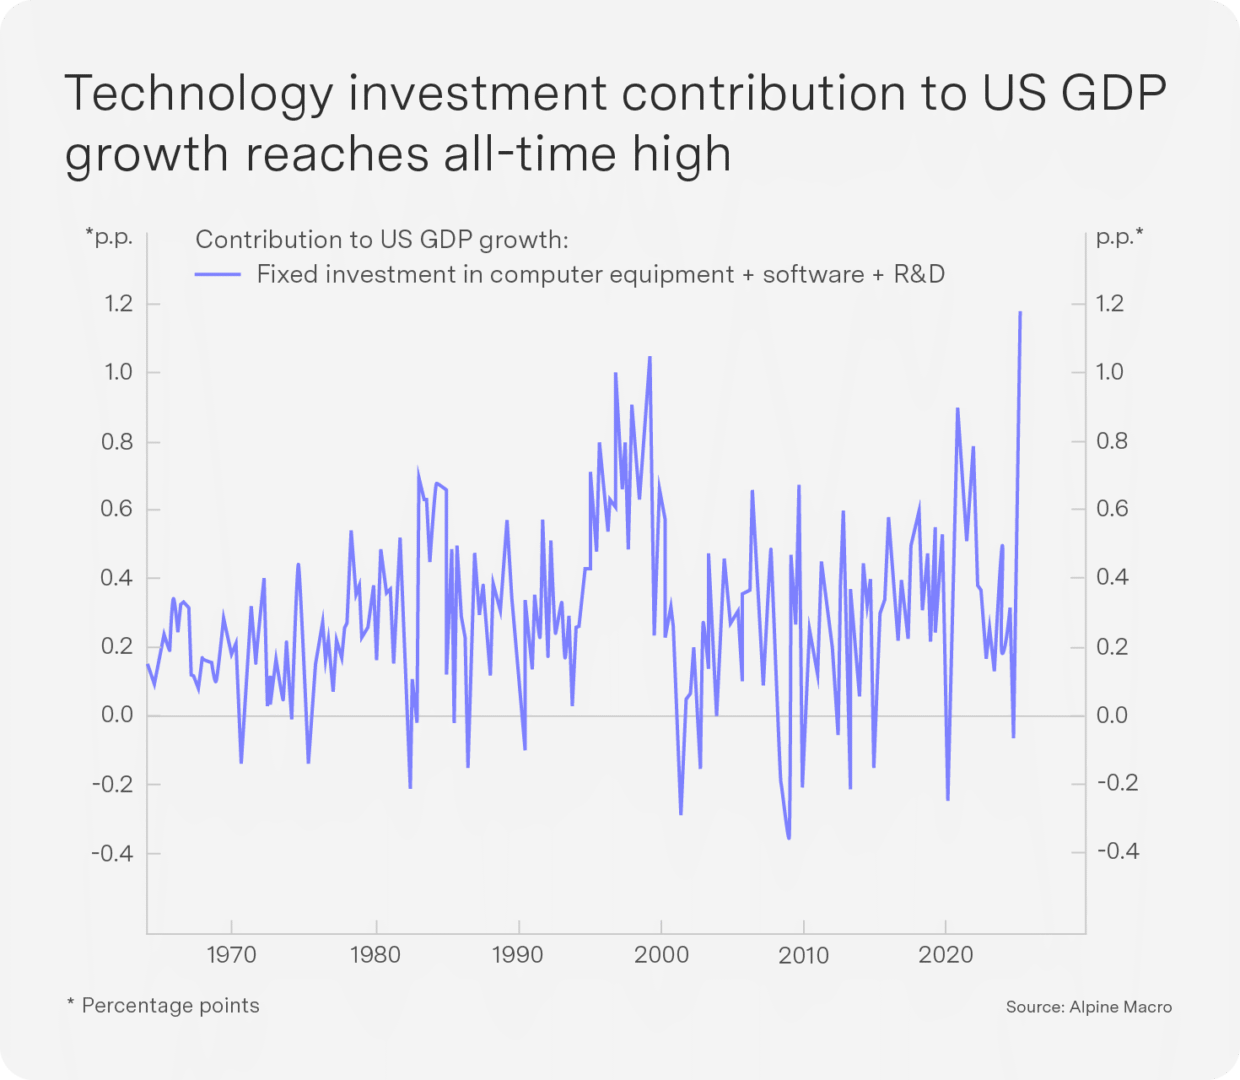
US: AI investment reaches unprecedented levels

The AI infrastructure boom is making an outsized contribution to American economic growth. Despite being just 4.5% of GDP, tech investment spending related to AI has contributed nearly as much to GDP growth this year as has consumer spending, which comprises 68% of the economy. The AI infrastructure boom is one of the largest capital deployment cycles in tech history (see Chart), with implications extending from semiconductor supply chains to real estate to power generation.
OpenAI CEO Sam Altman orchestrated a series of unprecedented infrastructure deals over the past month, committing to more than 26 gigawatts of computing capacity from Oracle, Nvidia, AMD and Broadcom. According to Financial Times calculations, these agreements represent over $1 trillion in spending commitments across the next decade – before a $250 billion deal with Microsoft’s Azure. The scale is staggering, requiring the power equivalent of about 26 nuclear reactors. OpenAI’s aggressive expansion strategy comes against a backdrop of significant operating losses. While the company books $13 billion in annual recurring revenue, its operating loss in the first half of the year was $8 billion. The company is pursuing multiple avenues to bridge this gap, with the main strategy being to “leverage other people’s balance sheets”.
The AI buildout is fundamentally transforming the economics of tech companies. Hyperscalers increasingly resemble infrastructure builders rather than capital-light platform businesses. The Magnificent Seven’s 12-month capital expenditure to the end of the third quarter is expected to be over $400 billion. US growth is being supported by this capital spending even as hiring slows. Whether productivity growth can continue depends on how these investments are monetised. For now, capex is in the driver’s seat, and the latest data suggest it has room to run.
China: Exports fuel growth for now, but 15th Five-Year Plan looks inwards

President Trump met with president Xi Jinping in South Korea at the end of the month. Despite Trump claiming this as an “amazing” deal for the US, China appears to be winning the trade war. The US agreed to cut the fentanyl-related tariffs on Chinese goods from 20% to 10%, while Beijing agreed to pause rare-earth export restrictions for a year.
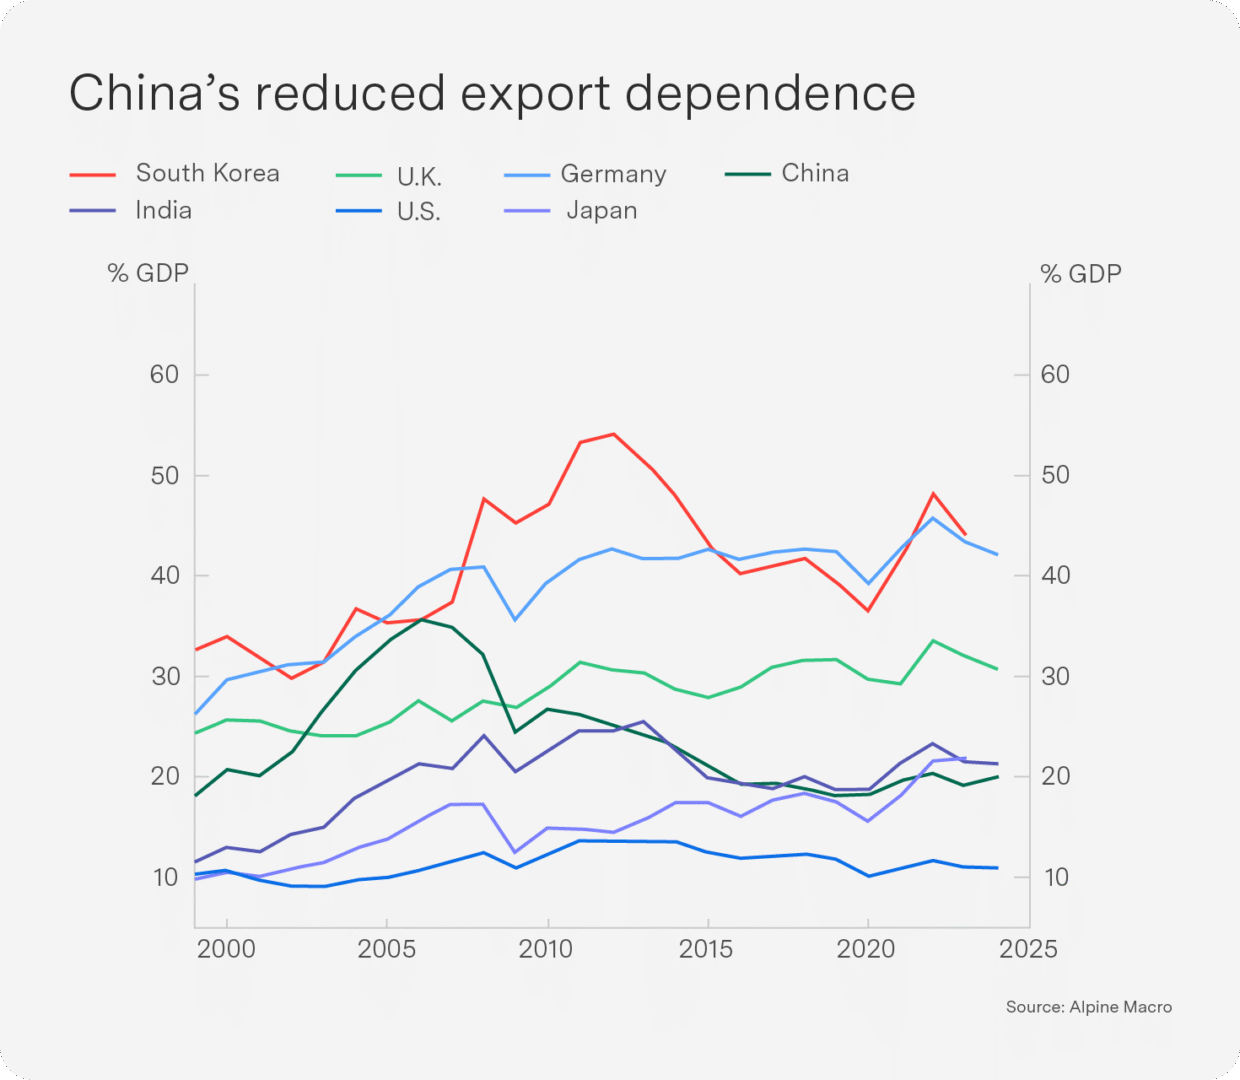
China’s exports surged at their fastest pace in six months in September 2025, supporting economic growth despite US tariff pressures. While exports to the US declined 27%, shipments to other global markets hit new highs. This export resilience contributed 1.2 percentage points to China’s 4.8% year-on-year GDP growth in Q3, beating market expectations of 4.7%. China’s growth resilience is evident in its commodity imports for September: gold imports rose to a five-month high, while palladium imports were six times higher than a year ago and refined copper imports rebounded to a year-to-date high. However, investment weakened broadly and consumer spending softened in Q3 as a previously effective goods trade-in program lost momentum.
Despite China’s shrinking export dependence (about 20% of GDP is currently from exports, similar to India and Japan but far below many major economies), China’s economic scale and external surpluses generate ongoing global trade tensions, and private consumption remains subdued. China’s 15th Five-Year Plan (2026–2030), the strategic blueprint for its economy, has thus continued to shift focus from an export-driven growth model to one anchored in domestic demand, increased technological self-reliance, improved social welfare, rural revitalisation, diversifying trade partners and less dependency on critical material imports.
Outlook: IMF upgrades near-term growth, reduces for next year

As bad as things are, they are not as bad as expected – at least not yet, according to the International Monetary Fund. The global economy is expected to grow by 3.2% this year, up from the 3% predicted in July. The upgraded forecast is largely due to a burst in activity as companies and households rushed to get goods in anticipation of high tariffs, as well as a weaker dollar that supported trade. “It’s not as bad as we feared,” IMF Chief Economist Pierre-Olivier Gourinchas said. “But it’s worse than we anticipated a year ago and worse than we need.” The turn for the worse may arrive next year, when growth is expected to edge down to 3.1% as the impact of high levies is felt.
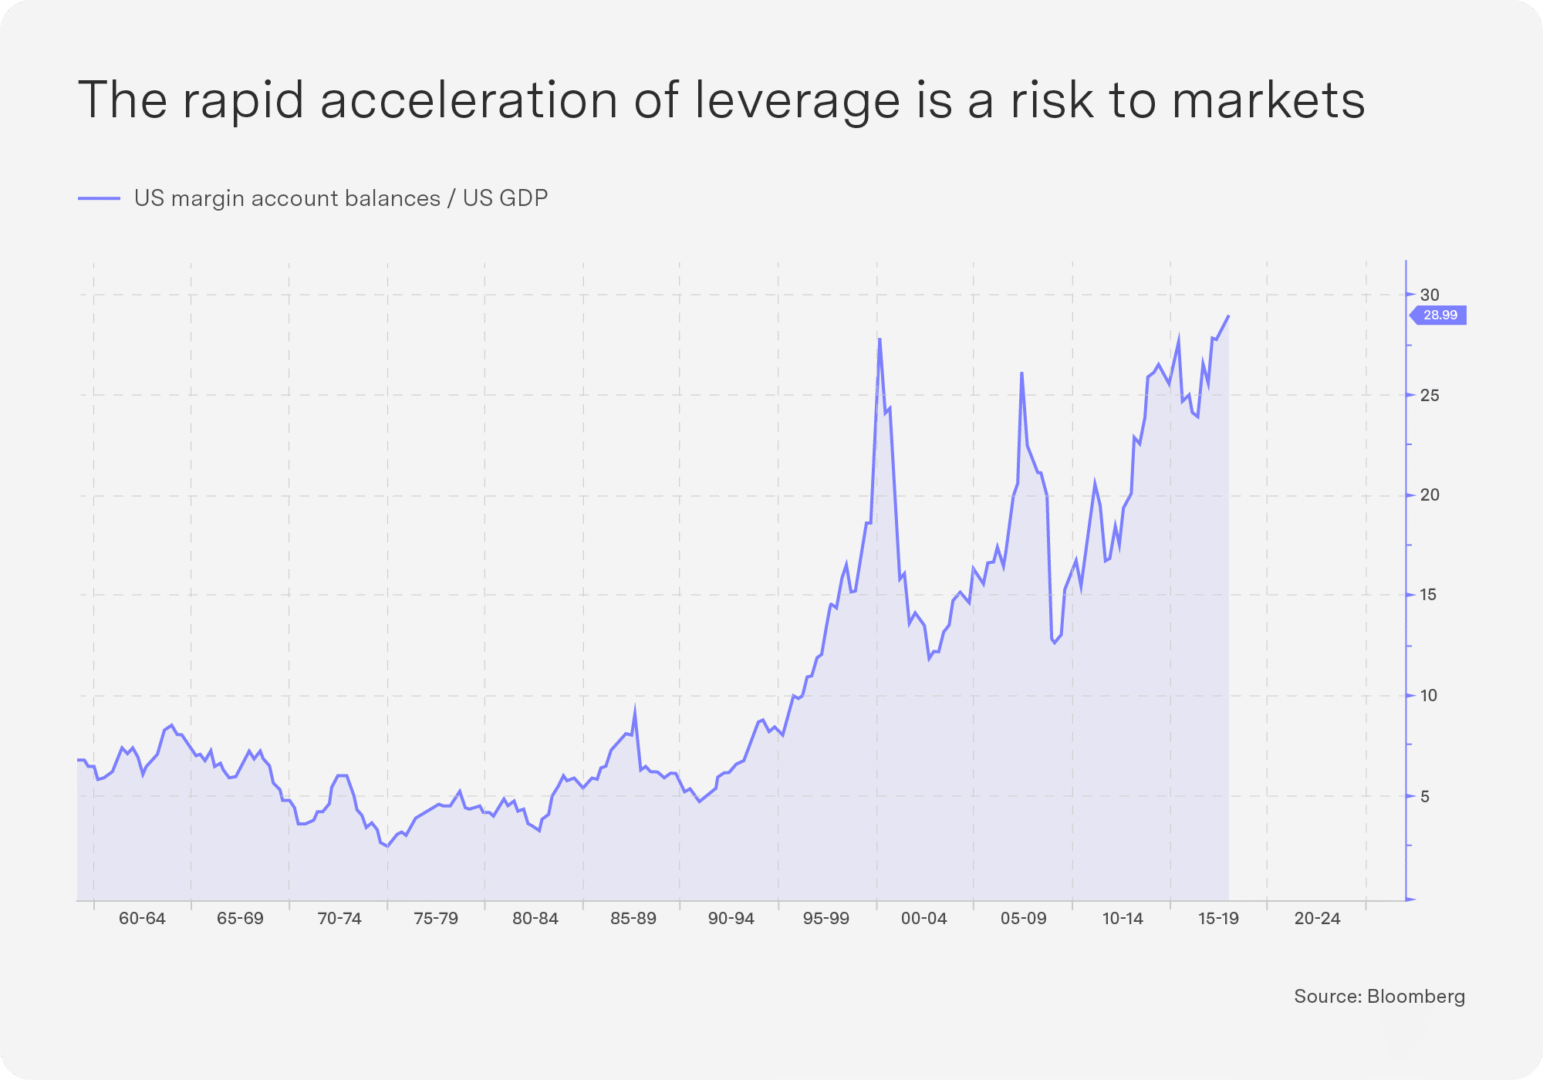
Higher levels of volatility are often common close to market tops, especially in bubbles, and October’s heightened volatility is likely to persist. For now, though, the Fed has continued to support the market with another rate cut in October and momentum remains strong, so we continue to not fight the Fed and position for rising markets and a weaker dollar despite the numerous risks (including rising inflation in the US, increasing geopolitical tensions with Russia and the rapid acceleration of leverage by US consumers to access the equity market pushing markets to elevated levels (see Chart)).
Key indicators