Gold: Debasement trade accelerates as US Treasury intervenes

Gold rallied 15% and bitcoin 27% after the US Treasury Department announced it would intervene in the US bond market following a surge in yields to their highest levels in decades. Markets pushed back against the move: Bond yields dipped only briefly before rising again, and the dollar fell to its weakest level in three months. This “debasement trade” had been building over the course of the month, fuelled initially by the US joining Japan in propping up the yen – an intervention widely seen as being motivated by concern that Japan might sell US Treasuries to defend its own currency.
Japan has been intervening in its bond market for years: The Bank of Japan ran yield curve control from 2016 to 2024, with large-scale official buying concentrated at the long end to suppress yields rather than let the market fully price the true cost of debt. That backdrop makes the comparison hard to dismiss: US national debt has just topped $40 trillion, having accelerated faster than predicted, in part due to the tax cuts under last summer’s Republican tax and spending bill, fuelling fears of a borrowing “doom loop”. This is known as fiscal dominance, a state in which the debt load is so high that the government is compelled to intervene in its own financing costs rather than let the market set the price, much as happened in Japan. The US Treasury is now suppressing yields directly, a form of financial repression that, over time, could erode the currency’s real value. This is a classic set-up for the debasement trade: Gold rallying as investors hedge against the erosion of currency purchasing power implied by financial repression.
The stakes around dollar debasement are real. The US relies on foreign investors to fund a large current account deficit and to hold a significant share of its debt overseas. Yet the more the government leans on interventionist moves to restrain yields rather than addressing the fundamentals driving up borrowing costs, the more likely it is that these debasement-trade rallies will extend across assets regarded as alternative stores of value to the dollar. Fed Chairman Kevin Warsh has been clear he wants bond-market price discovery to set the signal for rate policy without the Fed putting its thumb on the scale. Treasury Secretary Scott Bessent’s buybacks do the opposite, distorting the very signal Warsh is relying on.
The irony is, Bessent worked for Stanley Druckenmiller and George Soros when the pair forced sterling out of the European exchange rate mechanism in the 1990s, profiting from exactly this kind of forced realignment. Governments defending prices against fundamentals always lose. If Bessent the trader were still in the market, he would be positioning against Bessent the Treasury Secretary!
Positioning: We have adjusted our positioning to hedge against a weaker dollar and a higher gold price. Higher precious metals prices support both the budget deficit and the trade deficit. South African bonds are now neutral, and we are overweight SA equities.
Is current inflation hurting the middle class more?

Statistics South Africa’s June inflation number came in at 5.0%, up from 4.5% in May. Crucially for the South African Reserve Bank (SARB), this figure places early pressure on the new inflation-targeting range, and the SARB’s Monetary Policy Committee will be watching subsequent monthly releases closely. This seemingly benign change belies the important – and in some cases unusual – changes that have occurred in the nature and dynamics of price formation in the domestic economy.
Within the 5% headline number, though, food and beverage inflation is only at 1.6%. So the price of food and non-alcoholic beverages rose over the last month, but three times slower than headline inflation. We have become so accustomed to a food-inflation narrative in South Africa that talk of slowing food prices seems almost counterintuitive. Some food products have actually gone down in price. For example, the June release shows that food alone rose 1.4%, but processed food fell by 0.8%, cereal products by 1.5%, fruits and nuts by 10% and vegetables by 3.5%. A real low core-food-inflation story, which is good news. Perhaps less appreciated is that clothing inflation has also come down and contracted at 2.3% over the annualised monthly June 2025–26 period.
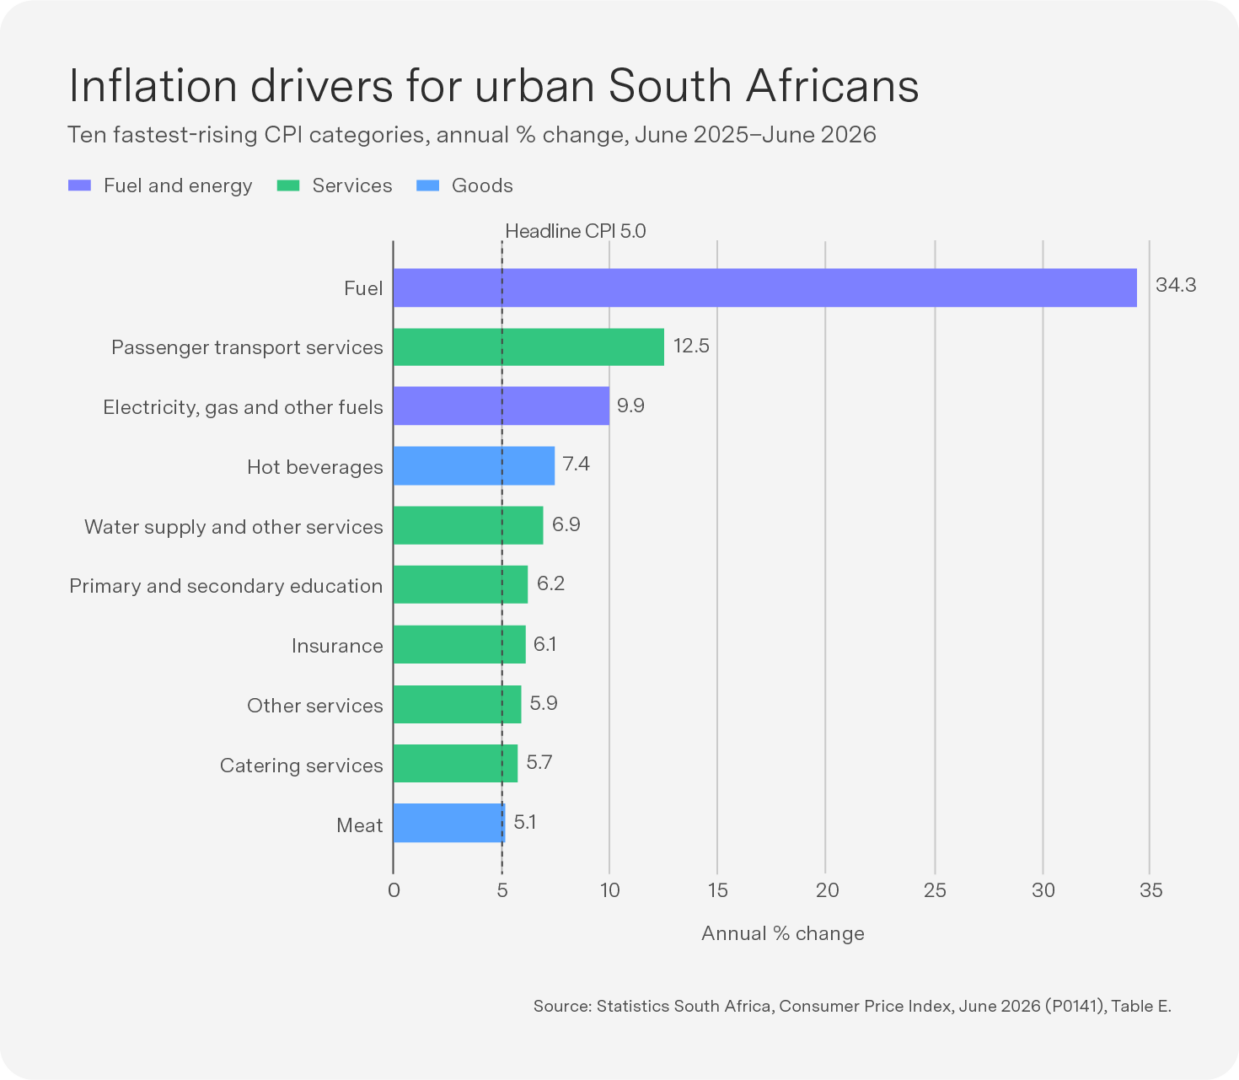
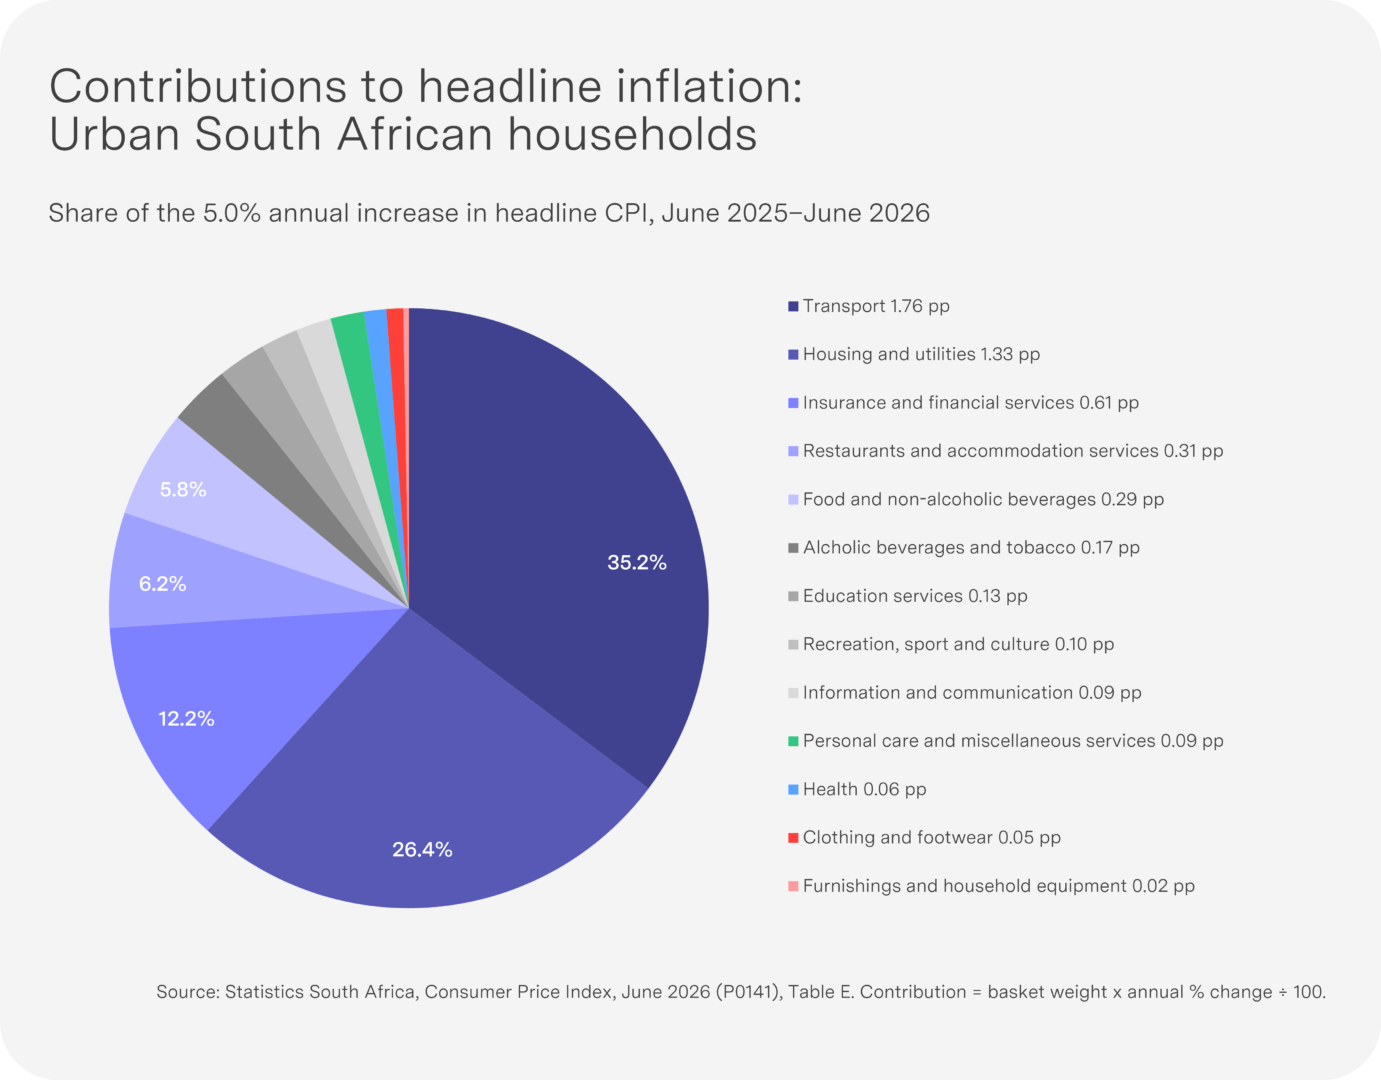
So what gives us this headline figure of 5%? The data offer some very strong clues. First, annualised CPI for the June 2024–25 period excluding administered prices was only 3.4%. Second, CPI for the same period excluding fuel was 3.8%, and third, the CPI is in at 4.9% (excluding housing). These numbers show the real drivers of inflation in this period, namely energy and water prices (administered prices), fuel and, to a lesser extent, housing. The graphic below confirms this, showing detailed product-level inflation drivers for urban households. Fuel inflation was a whopping 34%, leading to transport inflation of 12.5%, while energy and water inflation came in at 10% and 7% respectively.
Our inflation composition has thus shifted away from the traditional food and possibly fuel-based price effect to one more defined by energy and water. This is partly a legacy of load shedding and state capture, as households are paying for Eskom’s debt following a decade of plunder and mismanagement. This utilities inflation is also in part a function of water scarcity in a climate-changing world – and more recently a function of municipality mismanagement, which has resulted in a toxic debt-inflation relationship across a multitude of local governments around the country.
One worthy digression for stock pickers examining this new inflation dynamic in 2026 is that retailers in clothing, food and associated goods do not do well in this price environment. Low food and clothing inflation slows nominal revenue growth, while major costs – notably energy, water and fuel – have risen faster and squeezed margins. Unless retailers generate sufficiently strong volume growth, this cost mismatch compresses operating margins and makes earnings growth look weak.
We cannot be certain whether these single product price increases are pervasive enough to raise general price levels in the economy. For example, a very high meat inflation rate would be interesting but not important to overall inflation in an economy where very few individuals consume meat. This is the domain of expenditure weights, that is, what share of the household budget accrues to a particular product or service. The evidence from the recent data suggest that inflation in this reporting period has become services-based. Transport, housing, utilities and financial and insurance services inflation accounts for close to 75% of the inflation experienced by urban South African households. If we include all services, total services inflation accounts for 90% of the average urban household experience of price increases. Due to the once-off fuel spike, transport may be worth excluding, leaving ‘pure services non-transport based inflation’ responsible for 55% of all urban domestic inflation. The average urban household is grappling more with price hikes in medical aid contributions, school fees and insurance fees than they are with food price hikes this year.
Richer households are generally well protected against all forms of inflation, but these figures suggest that middle class households are now experiencing a higher inflation rate than poorer households. I argued in a previous Sygnals that poorer households experience higher inflation during food-price episodes, while middle-class households suffer during energy and housing price episodes. We are now clearly in the second regime, as services inflation is the driver (with fuel) of the aggregate CPI. Urban voters with government-rendered services (energy, water and education) whose prices have gone up may well have the perceived culprit of their hardships uppermost in their minds come the November elections.
While this signals the emergence of a services inflation model for South Africa, food as a driver of inflation is always just one drought or similar crisis event away. Urban middle class households have become predominantly services-based consumers, though, so I cautiously suggest that urban domestic inflation being predominantly services-driven – not goods-based – is here to stay. The challenge for the SARB remains how to navigate a services inflation dynamic while keeping an eye on wage settlements in the public sector for middle class union members that could create pressure on National Treasury’s 4% wage bill adjustment target. The policy lesson here is one I have made before: an inflation problem driven principally by administered prices and wage settlements is not a problem that interest rates can solve.
Top-performing Sygnia funds

The bitcoin fund jumped into top position and the South African Top 40 indexes into second and third on the back of gold and bitcoin rallies after US Treasury intervention in the US bond market. South Africa was in the top 5, specifically the gold-heavy Top 40 Index. The FANG.AI fund bounced on the back of strong Q2 hyperscaler results, including a 23% rally by Crowdstrike as companies increase cybersecurity spend to protect against AI risks.
Emerging markets (EMs) remain king over 12 months, with South Africa doing well in the remaining positions across bonds and equities.
1-month absolute performance as at 30 August 2026
- Sygnia Life Bitcoin Plus Fund: 19.6%
- Sygnia Itrix Top 40 ETF: 7.6%
- Sygnia Top 40 Index Fund: 7.4%
- Sygnia FANG.AI Equity Fund: 6.2%
- Sygnia Itrix FANG.AI Actively Managed ETF: 5.9%
12-month absolute performance as at 30 August 2026
- Sygnia Itrix MSCI Emerging Markets 50 ETF: 45.4%
- Sygnia Itrix Top 40 ETF: 21.4%
- Sygnia Top 40 Index Fund: 21.3%
- Sygnia Transnational Equities Fund: 20.8%
- Sygnia Listed Property Index Fund: 18.7%
US: Why cash still beats profit, and profit still beats revenue

The hyperscalers fed the bulls in August, pushing markets to all-time highs. Google, Amazon and Microsoft cleared a high bar for investors, with stronger cloud growth, cloud backlog expansion and improved operating cash flow visibility. S&P 500 second-quarter 2026 earnings growth was the best outside of a recession period since at least 1988 pushing headline price to earnings (P/E) ratios down and making equities look cheap, at least on the surface.
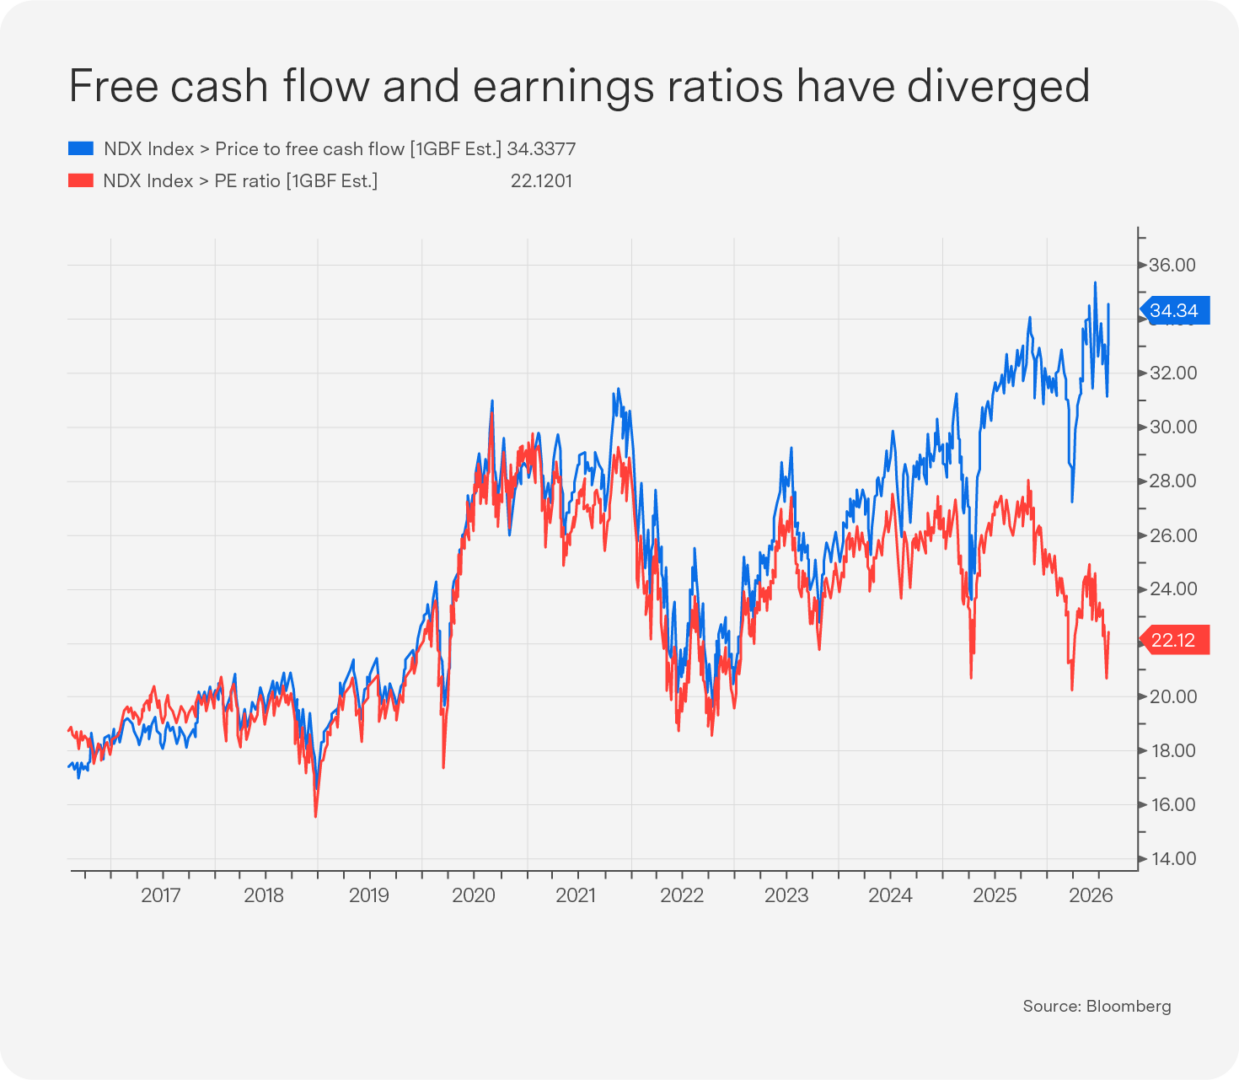
As Warren Buffett reminds us, it is cash flow that matters, and that picture is very different. Price-to-free-cash-flow ratios have diverged sharply from P/E ratios over the last two years (see chart). Part of this gap is a result of cash being consumed by capex, and part is from the rising valuations of private investments flowing through into earnings. On the first issue, AI capex keeps climbing: Second-quarter results and updated guidance pushed projected 2027 hyperscaler capex from ~$950bn to ~$1.050tn, and free cash flow remains under pressure as a result. On the second, JPMorgan reports that mark-to-market gains on private investments, notably Anthropic’s $65bn Series H round, inflated Google and Amazon net income by more than 220% year-on-year. Combined, these gains added about 6% of the index’s expected full-year earnings growth.
Although free cash flow is expected to stay negative through FY27 and F28 for most hyperscalers, demand and order coverage are improving relative to capex which suggests monetisation may start ramping faster than spending. That remains a hope, however, as client cost optimization, China open weight models and Small Language Models remain risks, and it is worth remembering the old adage that “revenue is vanity, profit is sanity, cash is king.”
AI’s price collapse: When good enough beats best in class

The Silicon Data LLM Token Expenditure Index has fallen roughly 50% from its May peak, a result of: i) companies switching from proprietary models to cheaper, highly capable open-weight alternatives (including Chinese offerings like DeepSeek, Qwen and Kimi), which they run on their servers; ii) tighter corporate budgets as companies introduce strict usage caps and switch from running every task on top-tier models to a more selective approach, reserving premium models for complex work and routing routine tasks to cheaper options; and iii) a move to small language models (SLMs). Overall, this is squeezing pricing power for frontier AI labs and pressuring software-layer margins, drawing greater scrutiny to the sector’s enormous capital spending.
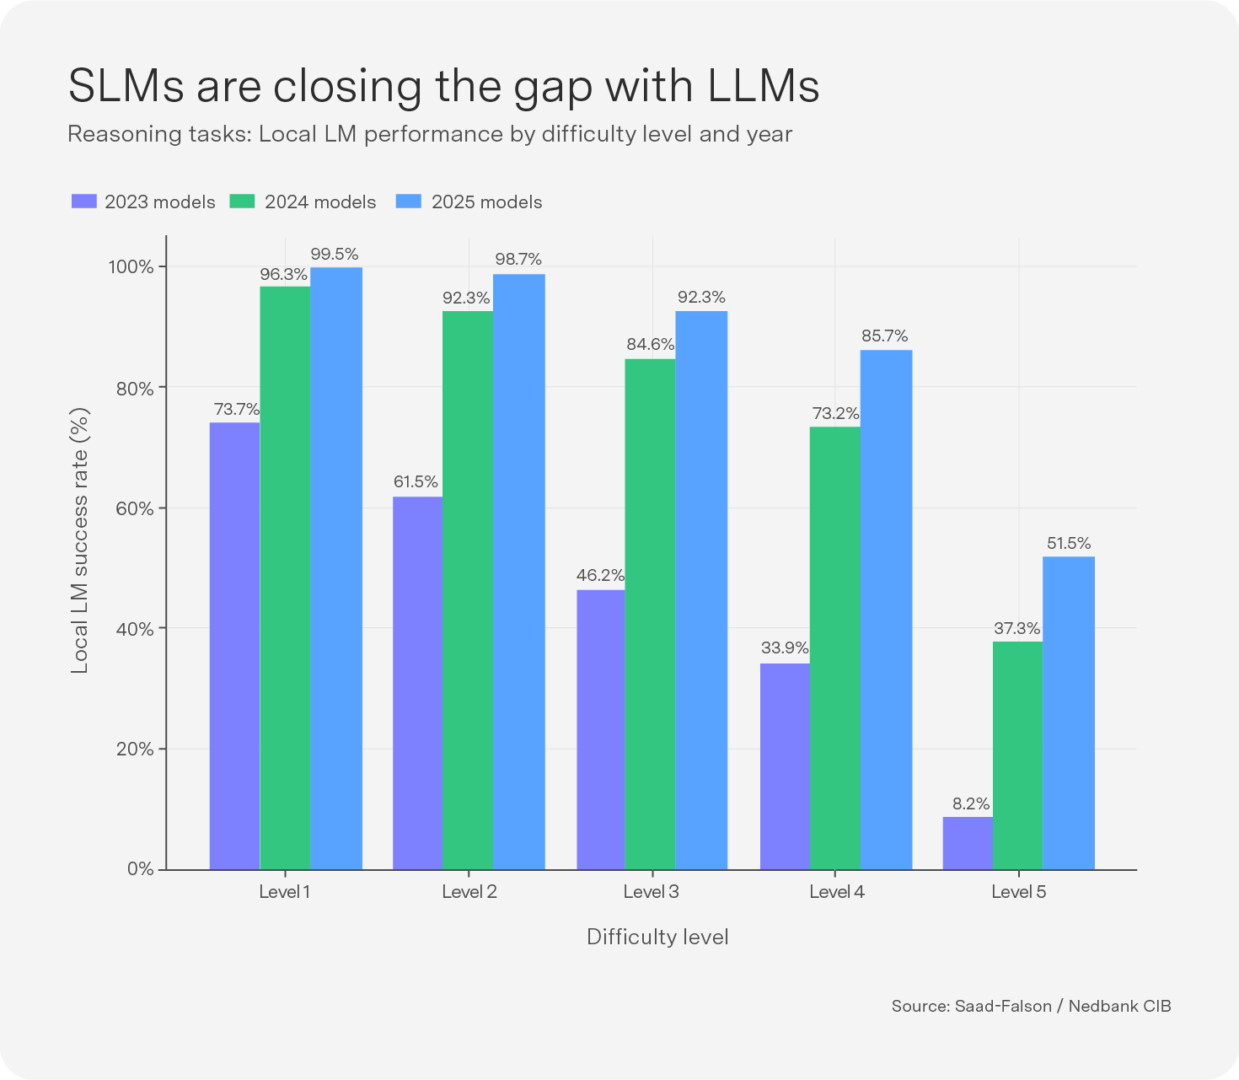
SLMs, which run on local desktops and mobile phones, are improving faster than LLMs. A Stanford University study showed that, the best SLM matched or beat LLM performance on chat queries in 90% or more cases, with an average score across all domains of 98.6%. On reasoning tasks alone, SLMs only matched or beat LLMs in 62.5% of cases. But SLMs are improving quickly on the reasoning side: in 2023, their success rate on reasoning tasks was roughly 50% across all five difficulty levels; by October 2025, SLMs had 99% success on the easiest tasks (levels 1 and 2 – see chart). SLMs achieve their results at 50–85% lower energy costs than LLMs, with inference per watt typically seven times more efficient. This trend could undermine the rationale for the current massive data centre roll-out. Apple appears to be positioning for this outcome, it has not raced into the AI model or data-centre space, and its hardware strategy is for on-device SLMs to run on phones and laptops.
The bullish arguments remain 1) that the index is usage-weighted and partly reflects that cheaper AI is driving much higher usage volumes. 2) LLMs will still be required for the most complex and agentic tasks 3) long dated cloud compute pricing remains steady and at a large premium to spot. While spot runs are around $3 per GPU hour, long dated contracts are pricing closer to $9, which should protect cloud margins
China’s tech ecosystem goes its own way – is this the turning point?

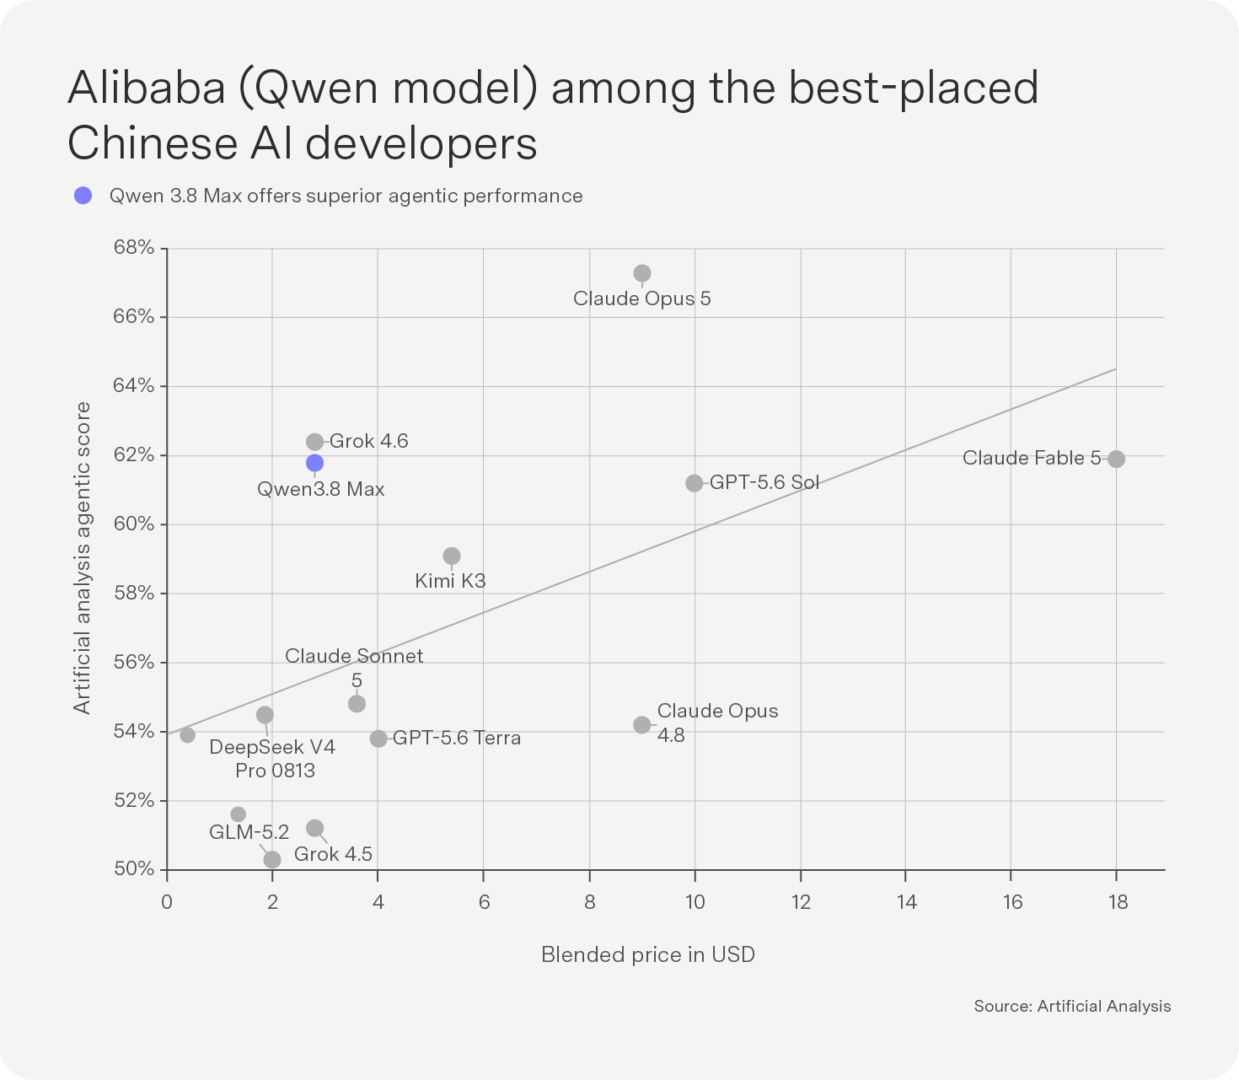
China’s parallel technology ecosystem now spans every layer of the AI value chain, though Internet platforms remain its foundation. Alibaba, Tencent, Baidu and ByteDance continue to invest aggressively in AI infrastructure and robotics, and Alibaba’s Qwen 3.8 AI model has had over 3 billion downloads. The company is well placed to turn increasingly capable models into revenue, with its latest agentic tools potentially extending monetisation beyond cheap tokens into its integrated enterprise network (see chart). The new generation of AI startups, such as DeepSeek and Moonshot, is also pushing the frontier of algorithmic efficiency, and domestic hardware champions are emerging across the semiconductor supply chain, from chip design and manufacturing to equipment and software, with CXMT reaching an astounding market cap of $600bn, eclipsing Tencent.
Trade data confirm this trend: China’s high-tech exports surged 40.7% over the first seven months of 2026, while July chip exports alone jumped 117% year-on-year. This underscores the growing weight of advanced manufacturing in China’s export mix.
On a price-to-sales and enterprise value (EV/EBITDA) basis, China tech still looks cheap relative to its US counterparts. This is because return on equity is low and margins are thin as China strives for market share and not for profits. But model pricing among Chinese AI is rising, with Kimi K3 now priced at roughly half of comparable US offerings, up from around a tenth of older models, while DeepSeek has pushed through price increases. China could be positioning itself to take on profits not just market share.
Wars: Supply disruption sees diesel and wheat prices soar

Crude oil prices are relatively contained at well under $100/barrel, but this is cold comfort for central banks worrying about rising inflationary pressures as widening refining margins show the true impact of the wars in Ukraine and Iran. Supply disruptions should continue to support diesel prices, with diesel more exposed to Strait of Hormuz risk than gasoline. Global refinery runs have fallen 7.2m barrels/day (mb/d) year on year, pushing the European wholesale diesel margin to an all-time high of $65/barrel. Diesel and gasoline inventories remain below seven-year-range lows, and refiners are now paying nearly as much for refining as for crude (see chart). Outages remain elevated (Russia ~4 mb/d, Middle East ~2.5 mb/d), with limited near-term recovery expected.
Wheat futures climbed to their highest level in three years as escalating attacks on ships and port infrastructure in the Black Sea disrupt shipments from one of the world’s key grain-producing regions. Russia and Ukraine together account for roughly a quarter of global wheat production. Adding to this pressure, South Africa’s 2026 wheat harvest is expected to be its smallest since 2019.
Diesel is of particular importance given its widespread use in transport and agriculture. South Africa imports gas, diesel and petrol, with minimal crude, so refining margins have an outsized effect on domestic inflation. Consequently, CPI is expected to breach 5%.

Outlook: AI momentum, war supply disruptions, and government debt concerns

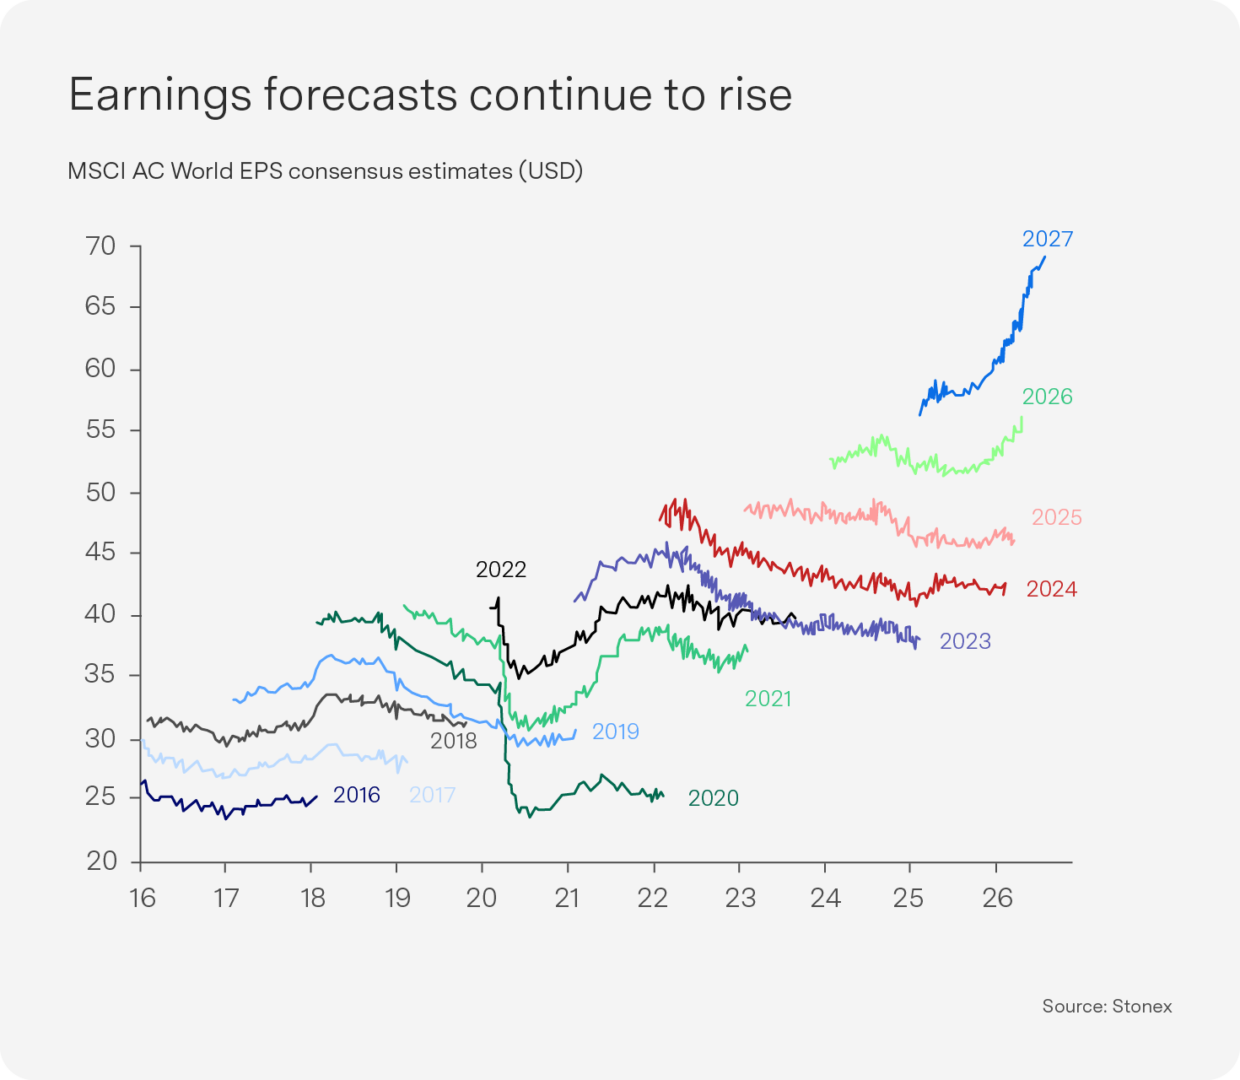
The AI bull run continues, pushing forecast 2027 earnings to record highs (see chart). It is important to note that these earnings are backed by lower ongoing profits once the revaluation of underlying investments is stripped out, and almost no cash flow once high capex is stripped out. Further risks include, SLMs, cheaper Chinese models and corporate price caps which could compress AI profit margins. For now, we remain cautiously overweight global equity.
US and Iran exchanged strikes for the first time in about a month, and the US has now announced Operation Economic Outcast to completely isolate Iran which includes threats to those that continue to conduct business with Tehran which risks escalation of conflict between US and China.
Russia and Ukraine have continued attacking each other, and the Middle East conflict looks like it may run on a similarly extended timeline. Crude may fall on supply improvements, but diesel is being driven by Middle East and Russian refining capacity, and the global wheat price is now seeing similar supply disruptions because of the war escalation.
In retaliation to US proposed tariffs, Canada has threatened to double its existing counter-tariffs on US steel and aluminium products and impose new duties, risking escalation with the US.
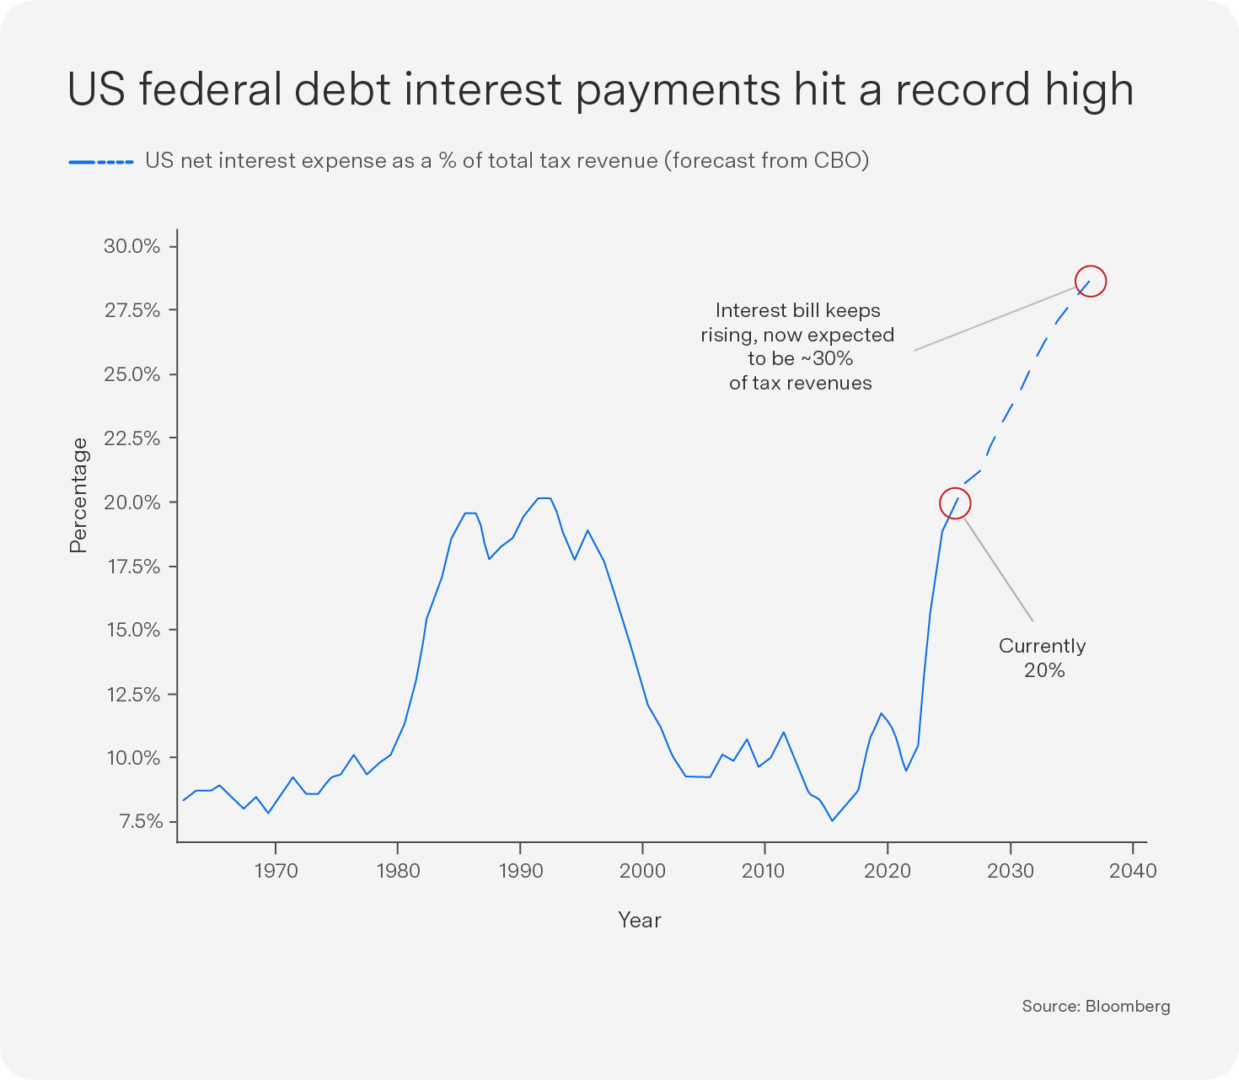
High government debt levels is also feeding into higher long-end real rates, suggesting greater headwinds to markets in the short term.
Food inflation is a risk globally. Within SA, Food and non-alcoholic beverages have kept the inflation basket lower as it saw the lowest inflation in more than 16 years but is likely to turn, on wheat prices and El Niño is strengthening. She South African Weather Service reported that in 2026 Cape Town had its lowest July rainfall since records began in 1958, a 68-year record and the US Climate Prediction Center said in August there is a 69% chance that conditions later this year will be the most severe since records began in 1950.