Geopolitical flashpoints and policy shocks drive market uncertainty
Global markets rose strongly in June despite a cocktail of geopolitical tensions and policy risk and the potential for simultaneous supply shocks from tariffs, migration constraints and rising oil prices.
Middle East escalation raises oil shock risk
Iran and Israel agreed to a ceasefire mediated by the United States and Qatar on 23 June, after 12 days of intense missile and drone strikes between Iran and Israel, and just one day after US operation “Midnight Hammer”, which “obliterated” Iran’s three uranium nuclear sites, including Fordow, a uranium-enrichment facility buried deep in a mountain. The ceasefire brought relief to the markets, with oil prices retracing half of their rise from May lows to below $70 per barrel. The situation remains volatile, however, with the future of Iran’s nuclear program uncertain. Despite Iran’s control over the Strait of Hormuz – a chokepoint for 20% of the world’s oil and natural gas shipments – the geopolitical landscape is quite different from that at the time of the 1991 Gulf War or the 2003 Iraq war. Israel now has total aerial control over Iran’s airspace, and the oil dependency ratio for global GDP has fallen nearly 70% since 1980. In addition, the US imported 25% of its 12 million barrels a day from the Persian Gulf prior to 2005 but has become an energy exporter – China now accounts for 90% of Iran’s oil exports (which US President Donald Trump is tolerating despite sanctions).
Tariff uncertainty adds to global drag
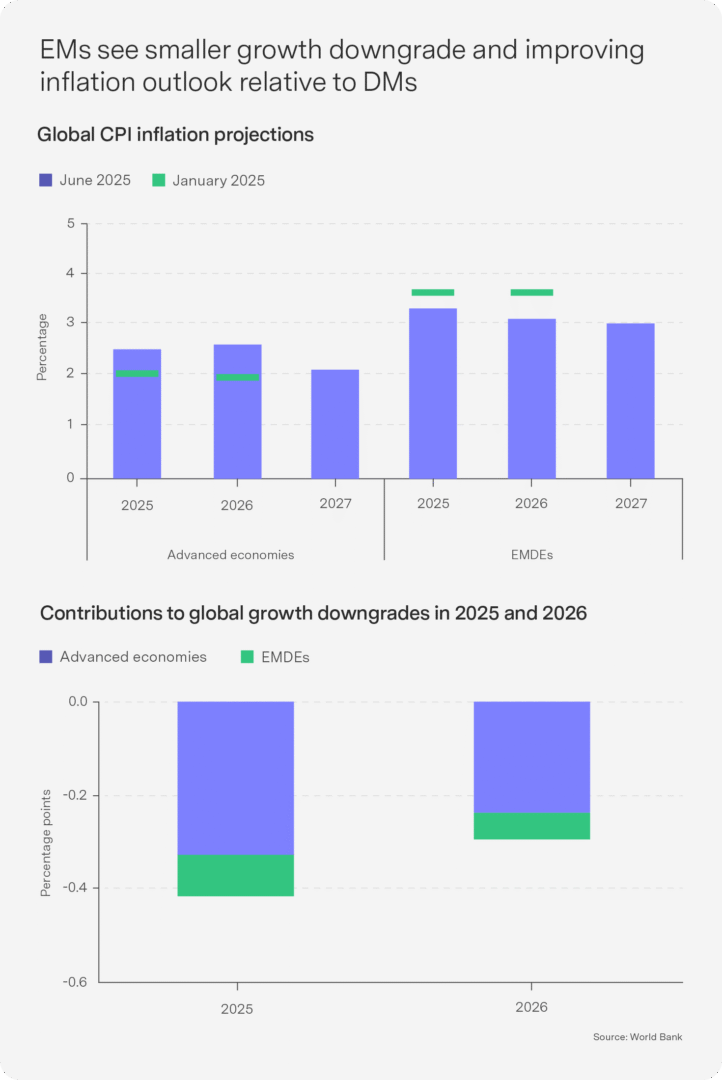
While the Middle East conflict increases geopolitical risk, the impact of tariffs on US growth and inflation remains the larger uncertainty, with the 90-day tariff pause granted by the US expiring on 9 July. Trump has warned that countries will receive a “take-it-or-leave-it” letter detailing tariff terms, though the 15 countries already engaged in negotiations with the US may see this an extension to the deadline. Tariff pass-through inflation in the US was minimal in May, but corporates are likely to begin passing costs on to consumers, with inflationary consequences over the coming quarters and reinforcing expectations of “higher for longer” interest rates and reduced growth. The World Bank concurred in its June outlook, downgrading its 2025 global growth forecast by 0.5 percentage points to 2.3%, projecting the weakest non-recessionary growth since 2008. Looking further ahead, average global growth in the 2020s is expected to settle around 2.5% – its slowest pace since the 1960s. Developed markets will bear the brunt of the growth downgrade and inflation increase, while emerging markets (EMs) will continue to offer a relatively resilient inflation–growth trade-off (see chart).
Is our unemployment really only 10%?

The recent statement by one of the country’s leading bankers that South Africa’s unemployment rate was grossly over-stated as a function of our poorly measured informal sector deserves closer reflection – if only because it goes to the heart of one of our domestic economic policy challenges. Both statements – a very high and very low level of unemployment – can be true depending on the sample.
I suspect the Capitec CEO made his inference from an internal sample, where a large number of bank accounts held by individuals seem to derive income without any ostensible formal registration attributes (such as a VAT number or personal income tax number).
Similarly, an NGO in a local township may find that frenetic informal sector activity belies national estimates. But a critical and very common assumption is made when analysing such sub-national statistics – that what is true at a local level must translate to a 1:1 relationship at national level. So a township with 40 000 informal firms from a population of 100 000 does not in fact mean that the national informal sector rate is 40%.
One of the roles of national statistics is to avoid this common error of “aggregation bias” – that what we see locally must be true for the economy as a whole. Many of my colleagues in academia have noted over the last few days that the Statistics South Africa data on unemployment, informality and the self-employed are correct. These data may not be technically perfect around, for example, weighting (admirably resolved by colleagues at the University of Cape Town), but they are not mismeasuring the unemployment rate by over 20%! South African economists have spent the better part of three decades analysing and engaging with the nationally representative statistics provided by the Quarterly Labour Force Statistics, General Household Survey and other national surveys. Often not appreciated by non-academic audiences is that these economists use the underlying unit record data to analyse indicators such as self-employment, informality and unemployment. It is a serious, statistically rigorous business that should not be underestimated.
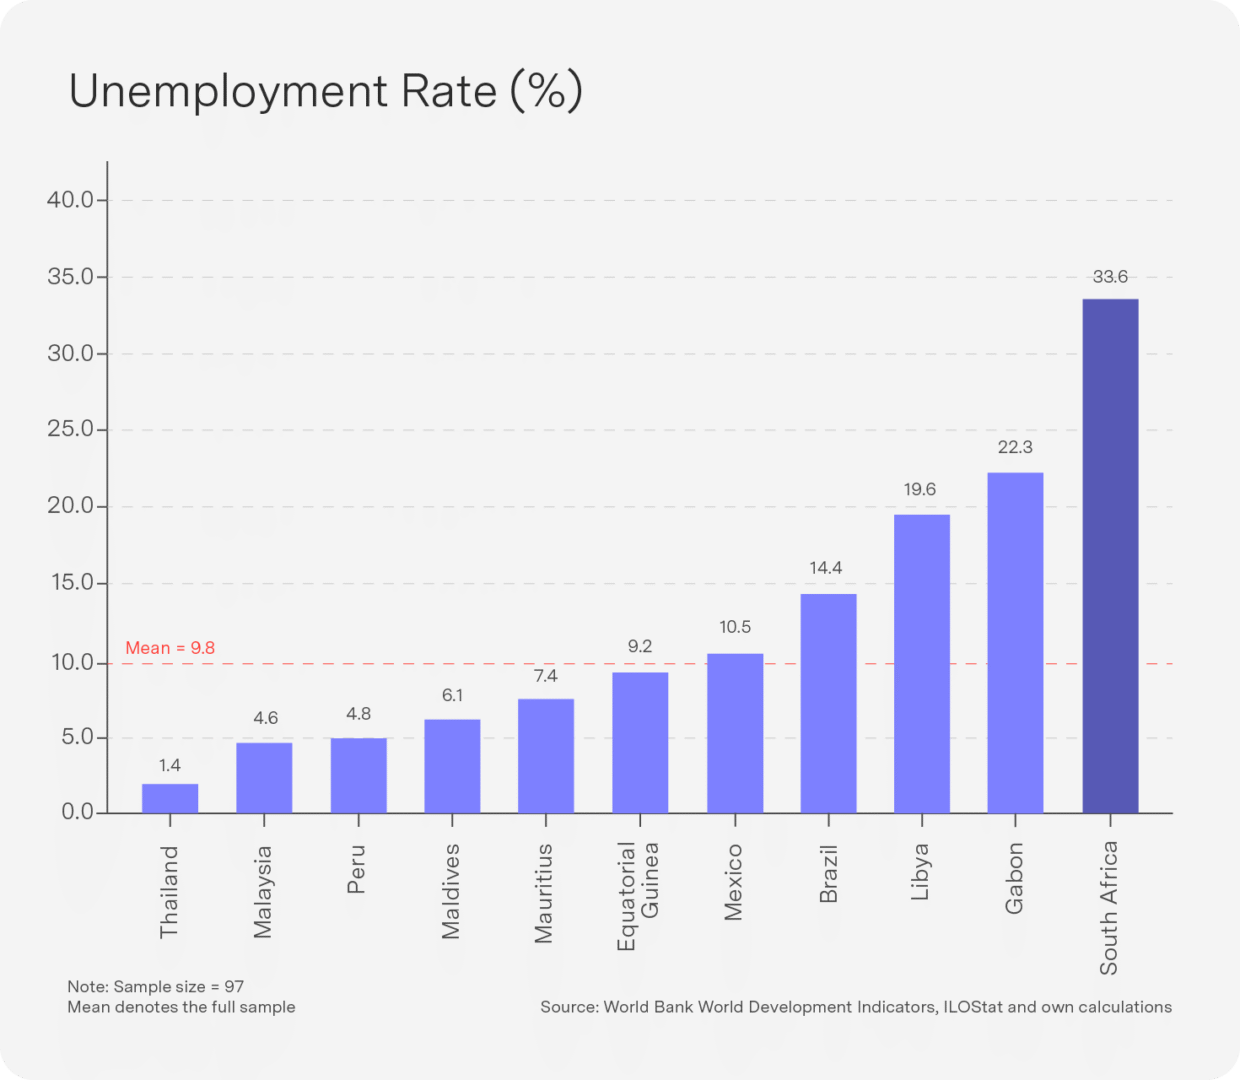
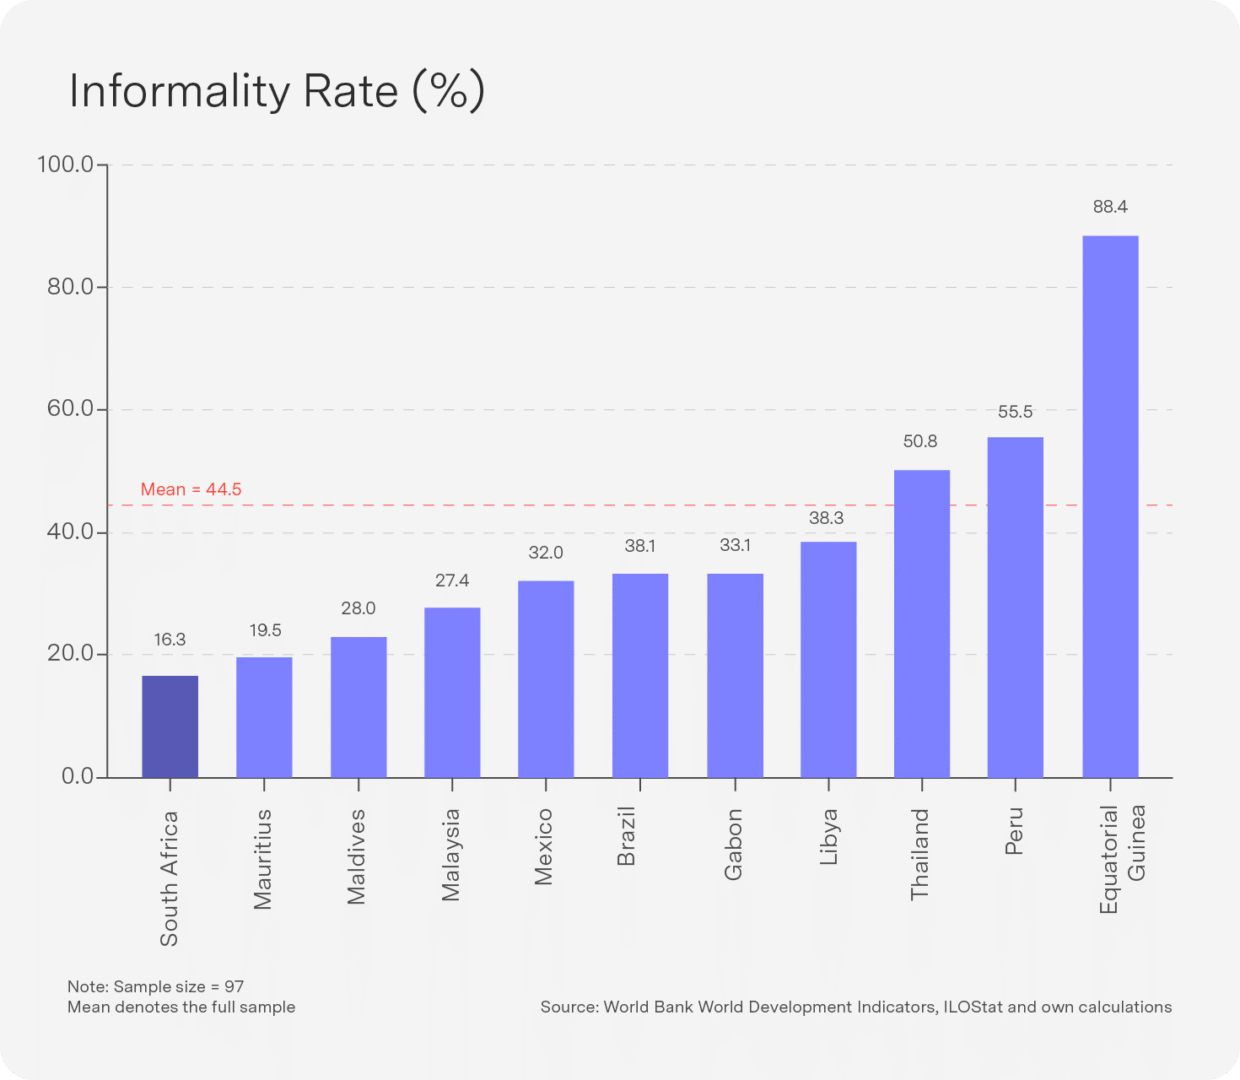
In broad terms, the data consistently show that South Africa simultaneously has one of the highest unemployment rates in the world (33.6%) and one of the lowest rates of informality (about 16.3%). Imminent research findings will also show that the average emerging market’s labour-market ratio of wage-employed to informally employed to unemployed is 45:45:10, but for South Africa it is 50:16:34. Most emerging markets do not close their labour markets by achieving much higher levels of wage employment than us but by permitting a relatively unhindered informal economy.
I am empirically satisfied that the most important reason for South Africa’s inordinately high unemployment rate is not poor employment elasticities, restrictive labour regulations and the like but an economy designed in so many different ways to stymie the informal sector.
For now, it is important to recognise that while personal engagements with clients, suppliers and consumers at local level may suggest high rates of informality and lower rates of open unemployment, the nationally representative, stratified data of Statistics South Africa correctly and respectfully disagree.
Top-performing Sygnia funds

1-month absolute performance as at 29 June 2025
- Sygnia Itrix MSCI Emerging Markets 50 ETF 7.0%
- Sygnia Itrix FANG.AI Actively Managed ETF 6.4%
- Sygnia FANG.AI Equity Fund 6.2%
- Sygnia Itrix 4th Industrial Revolution Global Equity Actively Managed ETF 4.6%
- Sygnia 4th Industrial Revolution Global Equity Fund 4.1%
The Sygnia EM 50 ETF topped the funds for the month, as EMs look more resilient to global tariff wars than the developed markets. US tech continued to outperform broad US stocks, taking up the rest of the top five positions.
The picture over 12 months is consistent with last month’s results. China is on top, pushing SA equities into the top five, with FANG hanging in in third place.
12-month absolute performance as at 29 June 2025
- Sygnia Itrix MSCI China Feeder ETF 28.0%
- Sygnia Itrix Top 40 ETF 26.4%
- Sygnia Itrix FANG.AI Actively Managed ETF 25.9%
- Sygnia Listed Property Index Fund 23.4%
- Sygnia Top 40 Index Fund 23.3%
US: Inflation surprises to the downside, but tariff pressures keep the Fed on hold

Tariff effects just beginning
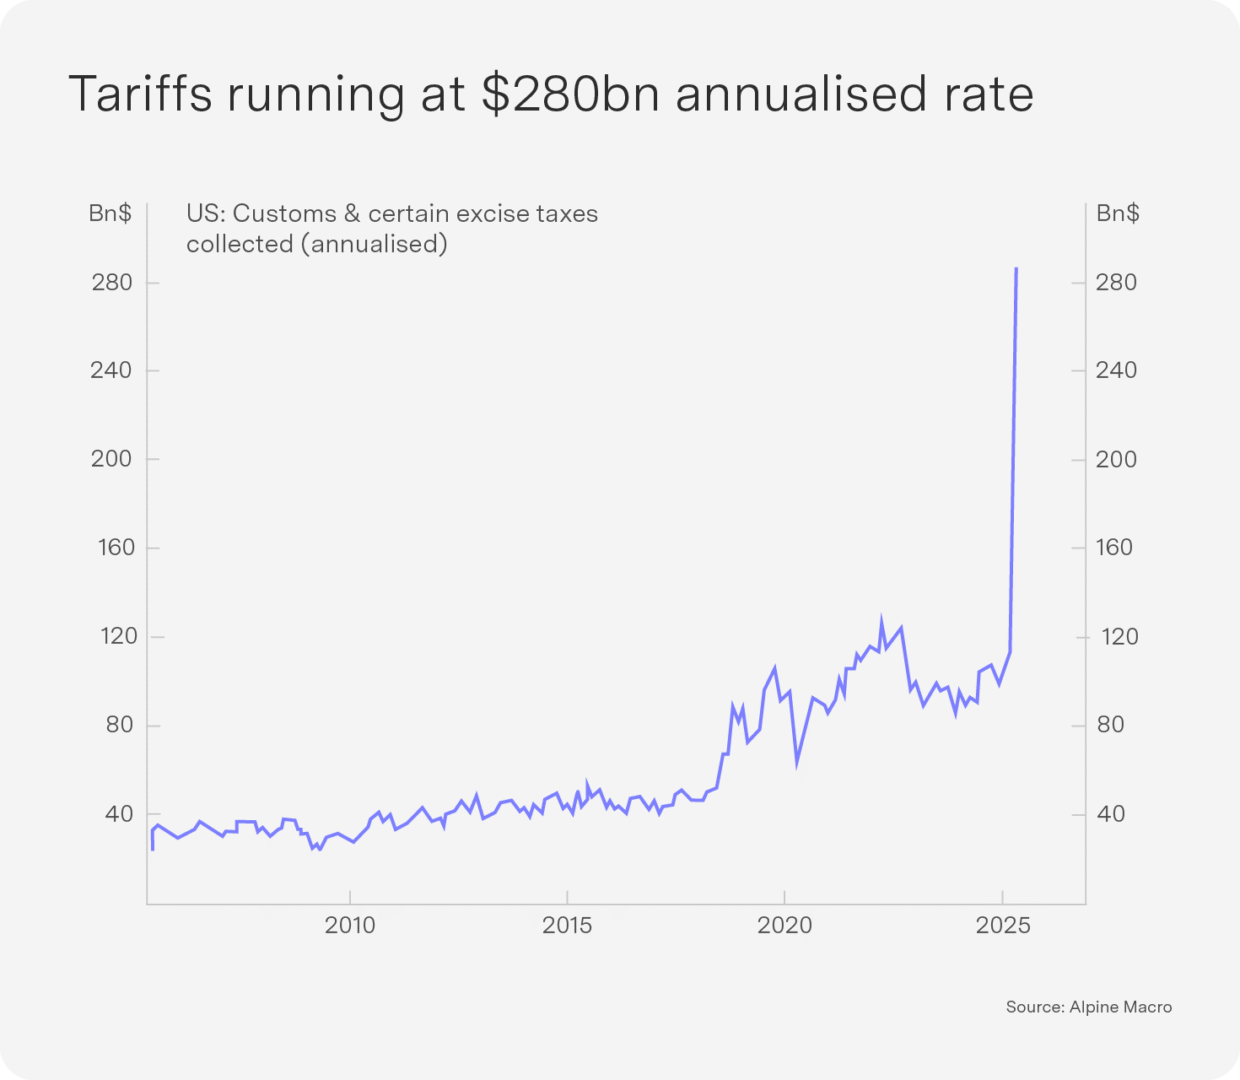
US inflation data for May offered a reprieve, rising by less than expected for the fourth consecutive month. While US firms have passed on some of the recent tariff costs – particularly on goods heavily exposed to China, such as appliances, electronics and household equipment – the full effect is still unfolding. A grace period allowed shipments en route before the April tariff announcement to enter the US without penalty before 27 May. In tandem with inventory on hand, this temporary delay has softened the initial inflationary hit, with Federal Reserve Chair Jerome Powell remarking that “it takes some time for tariffs to work their way through the supply chain to the consumer.” The Fed’s June Beige Book also noted that most firms expect to pass on tariff-related costs within three months; as such, a further uptick in inflation should materialise in the third quarter. JPMorgan estimates US inflation could rise to 5.4% in Q3. This is supported by US custom and excise tax collections, which have skyrocketed to a $280bn annualised rate (see chart).
Cautious consumers and disinflation in key segments
Offsetting some of the tariff pass-through, price declines in recreational services and durable goods have signalled growing consumer caution. While subdued inflation offers breathing room, it is ultimately a function of softer economic activity. Weak May retail sales, falling consumer confidence and continued softness in manufacturing data indicate slowing demand. The Yale Budget Lab estimates that the current 15%+ effective tariff rate could reduce year-end employment by 375 000 jobs. Jobless claims have risen to a three-and-a-half-year high, while non-farm payroll growth outside two core categories has stalled.
Fed outlook: Hawkish pause, rate cuts still projected
With growth slowing and inflation sticky, the Fed faces a difficult task. Despite slowing growth and a softening labour market, the Fed is in no rush to act. The updated dot plot still projects two rate cuts in 2025, but Powell has struck a more hawkish tone in recent remarks, repeatedly stressing the resilience of the economy and labour markets and the inflationary nature of tariffs. Any policy shift before September appears highly unlikely. While Trump has stated he will not remove Powell before his term ends in May 2026, he has renewed his criticism of him for not cutting rates; speculation is mounting that a more dovish replacement will follow.
EU: A bid for global reserve currency glory

European Central Bank (ECB) President Christine Lagarde made headlines by calling for the euro to play a more prominent role as a global reserve currency. With the US dollar under pressure amid concerns over slowing US growth, ballooning debt, the unresolved “big, beautiful bill” and speculation over who might replace Jerome Powell, the timing of this call is opportune. However, the euro’s path to global prominence remains fraught with structural and geopolitical challenges: Europe lacks a unified capital market, a centralised fiscal authority, a cohesive banking union and deep and liquid sovereign bond markets comparable to US Treasuries.
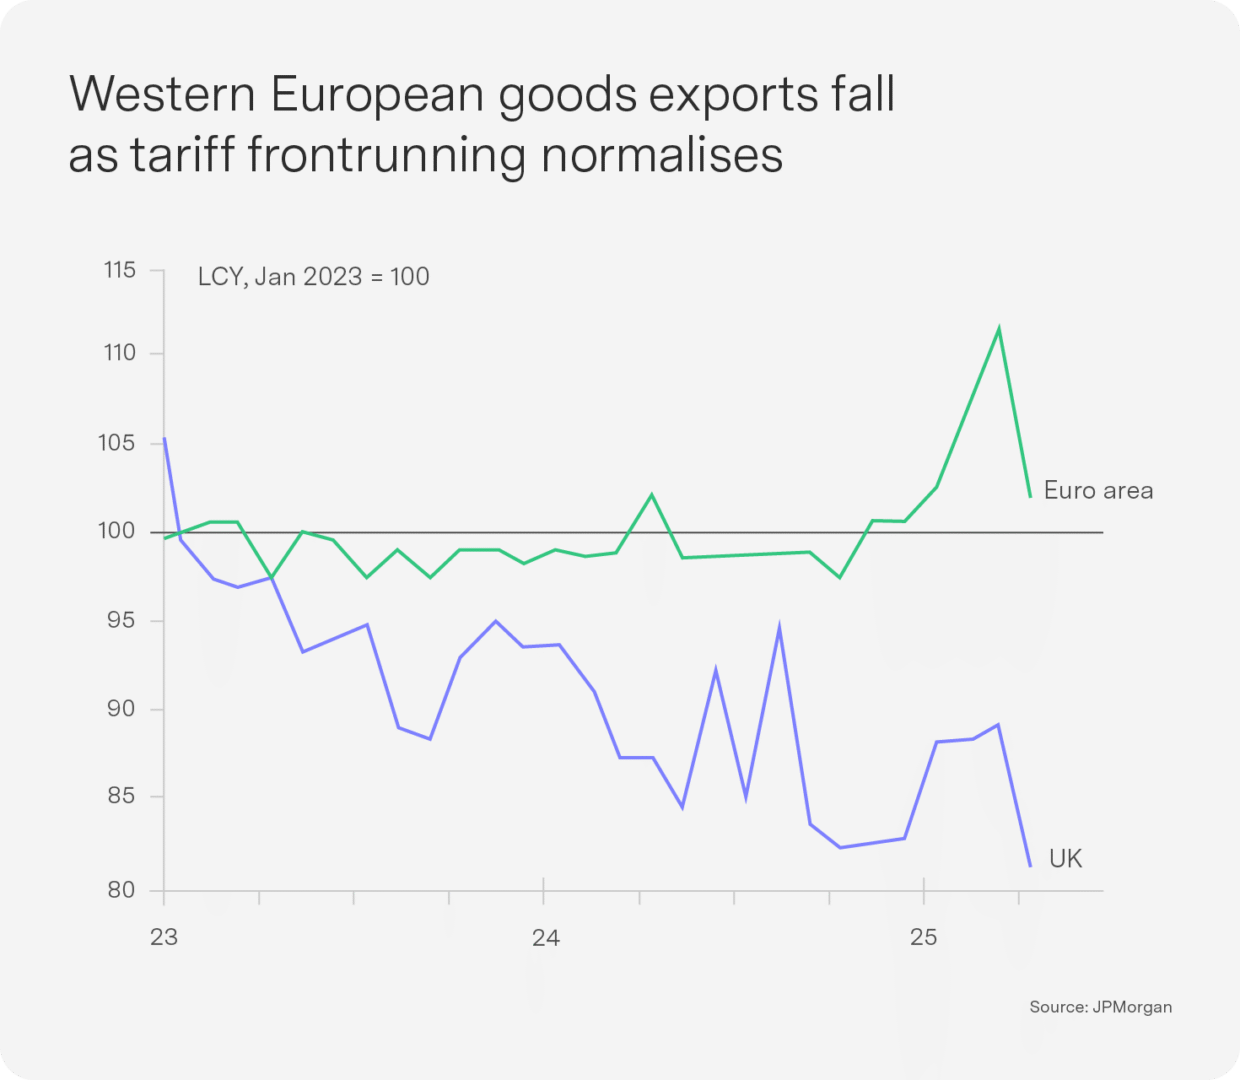
While Lagarde is focused on long-term monetary positioning, near-term risks threaten to derail growth across the eurozone. The ECB expects GDP growth of just 0.9% in 2025, but even that may be optimistic.
- Exports are weakening sharply, particularly as frontloading of US trade to avoid tariffs normalises (see chart).
- The Russia-Ukraine war is continuing, sustaining geopolitical and energy-related pressures.
- Trump-era tariff risks are escalating, with the US indicating that trade negotiations with the EU may not be resolved by the 9 July deadline. The EU’s slow pace of trade negotiation – seen clearly during Brexit – exacerbates the risk that the bloc may bear a disproportionate burden of any new US tariffs.
Emerging markets: Weathering the trade storm better than developed markets

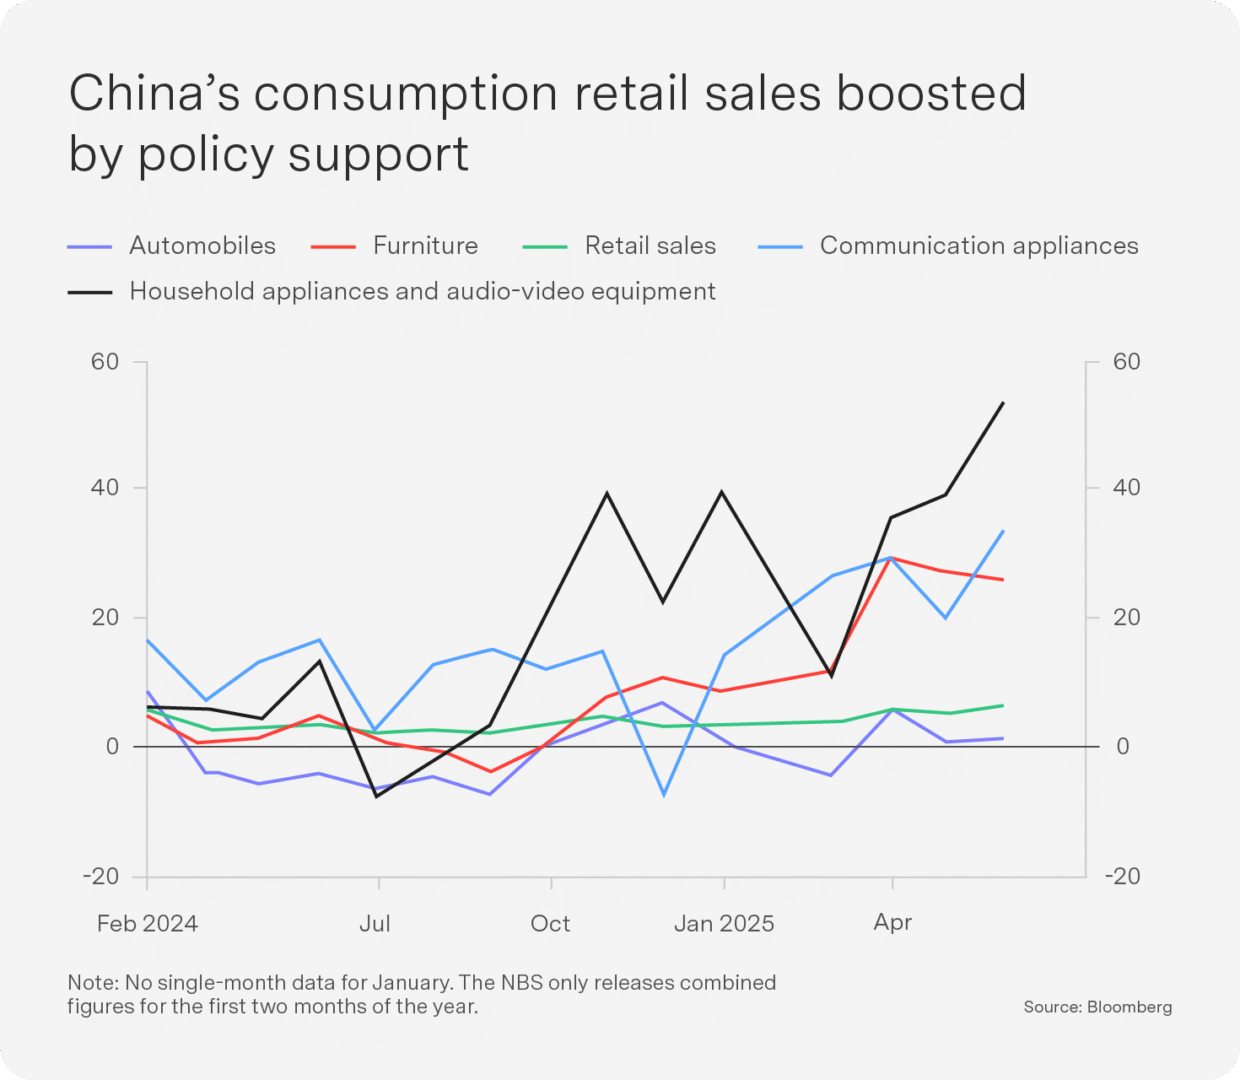
China’s economy is gaining traction, with early signs that policy stimulus is finally filtering through to the real economy:
- Money growth is accelerating, with real M1 – a leading indicator of economic activity – rising at its fastest pace in over a year.
- May retail sales rose to a 17-month high, bolstered by front-loaded fiscal support and targeted subsidies for durable goods such as home appliances (see chart).
Furthermore, China has emerged in a strong position in ongoing global trade negotiations – in large part due to its dominance in rare earth minerals. An agreement with the US was reached, imposing a total tariff of 55% (an effective rate of 33%).
Beyond China, EMs are capitalising on trade realignment:
- Trans-shipment opportunities – the trade war has catalysed a rerouting of global supply chains, creating new winners across EMs.
- With commodity prices holding firm, many EMs – particularly in Latin America and Africa – are enjoying improved terms of trade.
- A weakening US dollar is reducing financing costs, bolstering EM currencies and enhancing the appeal of local debt.
- EM inflation is forecast to decline more quickly than in developed markets (per the World Bank), allowing for further monetary easing.EM corporate earnings are now outpacing those in the US, driven by margin recovery and resilient revenue growth.
Outlook: Remaining cautious

Resilient growth but prepare for heightened uncertainty
The global consumer remains in good shape, financial conditions have eased and US long-term inflation expectations are stable, so we still expect the US to avoid a recession. In addition, we expect the near-term fiscal thrust in Germany and China to be around 2% of GDP. However, markets are entering a precarious period in which geopolitical risk, trade fragmentation and supply shocks intersect.
Dollar weakness likely to continue, but euro resilience is overdone
The dollar is usually the beneficiary in times of fear, but it has not rallied with current geopolitical tensions. Rate cuts in Europe may end soon even as the Fed starts to cut, so the euro may find further short-term cyclical support relative to the dollar. Despite dollar weakness and global appetite for currency diversification, however, the euro is unlikely to deliver on its “reserve currency moment” for some time.
Selectively overweight EM assets
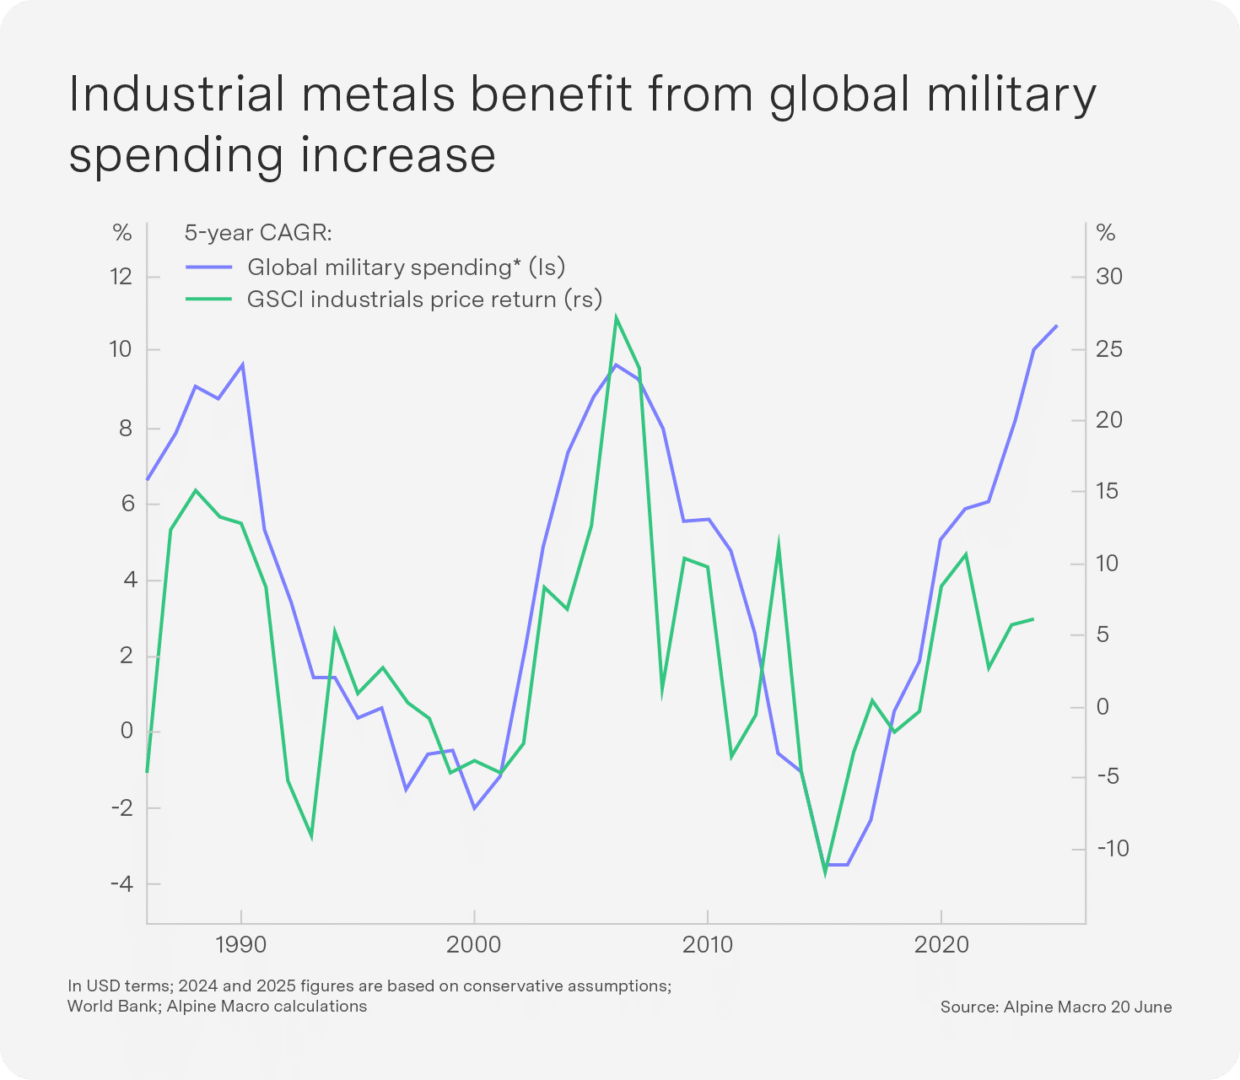
A combination of domestic tailwinds, global supply chain realignment and policy flexibility is positioning EMs for stronger near-term performance. China’s cyclical rebound, coupled with opportunities in EM debt and equity, present a compelling case for diversified exposure in multi-asset portfolios. Global industrial metal prices are also benefiting from the rise in global defence spending (see chart), a further tailwind for commodities and emerging markets. We have switched some of our South African exposure to EMs given better valuations, higher growth and more diversification.
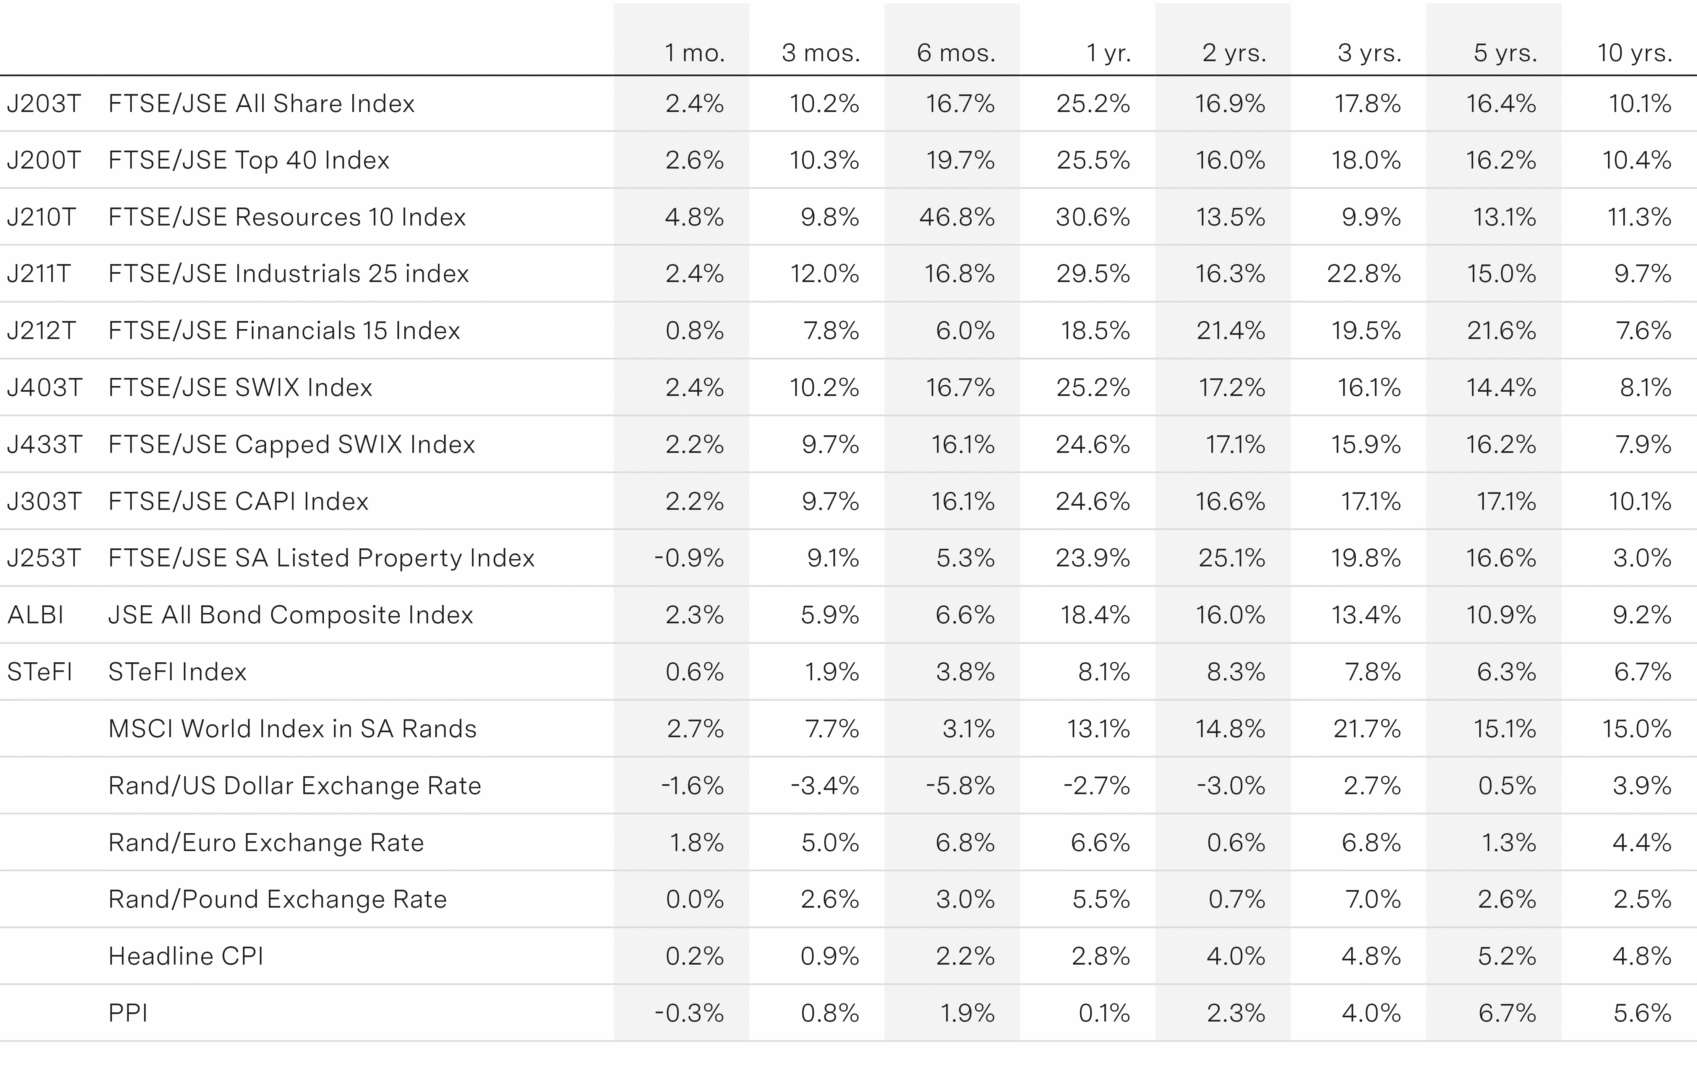
Key indicators