The Hormuz shock: When energy, food and chips all stop moving
Escalation between the US/Israel and Iran has driven crude oil to $120 per barrel (/bbl). Equity, currency and bond markets across Europe and emerging economies have sold off sharply as carry trades unwind. The dollar has strengthened and gold has softened, reaffirming the dollar’s safe-haven status in a high-geopolitical-risk environment.
US forces have bombed Iran’s Kharg Island, the country’s principal crude export hub. Iran has struck its Gulf neighbours hard, removing 12 million barrels per day (mb/d) of supply and effectively closing the Strait and impeding the 20 mb/d that ordinarily transits it. In response, the International Energy Agency released 400 million barrels – larger than any prior drawdown. The US has also permitted purchases of sanctioned Russian oil, estimated at 124 million barrels. However, these measures combined amount to only 26 days of Hormuz-replacement supply. Yemen’s Houthi militia have officially entered the war, which threatens to close the key Bab al-Mandab Strait, the alternative transit route via the Red Sea; this could impact a further 5mb/d of seaborne crude oil. On 18 March, Israel struck the Iranian portion of the South Pars/North Dome gas field, which is the largest gas field in the world and is shared with Qatar. Iran retaliated with widespread attacks on oil and gas infrastructure, impairing 17% of Qatar’s liquid natural gas (LNG) capacity for three to five years. Natural gas prices have almost doubled year-to-date.
Even a unilateral US declaration of “victory” would not produce a clean exit. Several structural obstacles remain:
- Iran has rejected the US’s 15-point proposal, wishing to maintain its nuclear facilities and gain recognition of its “authority” over the Strait of Hormuz.
- Iran “wins” by controlling the Strait. Iran is charging transit fees on some commercial vessels through the strait at $2m per voyage; the US has limited means to prevent Iranian drone attacks on Persian Gulf shipping, and Iranian mines make naval escorts operationally difficult.
- Russia benefits from a prolonged conflict, as higher prices are delivering a financial windfall to Moscow. Russia may also be supplying Iran with weapons.
- Israel has extended evacuation orders in southern Lebanon to cover 14% of the total area, and domestic Israeli polling shows overwhelming support for the operation Prime Minister Netanyahu has advocated for decades. Israeli skirmishes may thus independently continue to keep Iran engaged.
- Ports and infrastructure damaged during the conflict will take time to repair.
- Once drawn down, strategic reserves must be replenished, creating a persistent demand overhang.
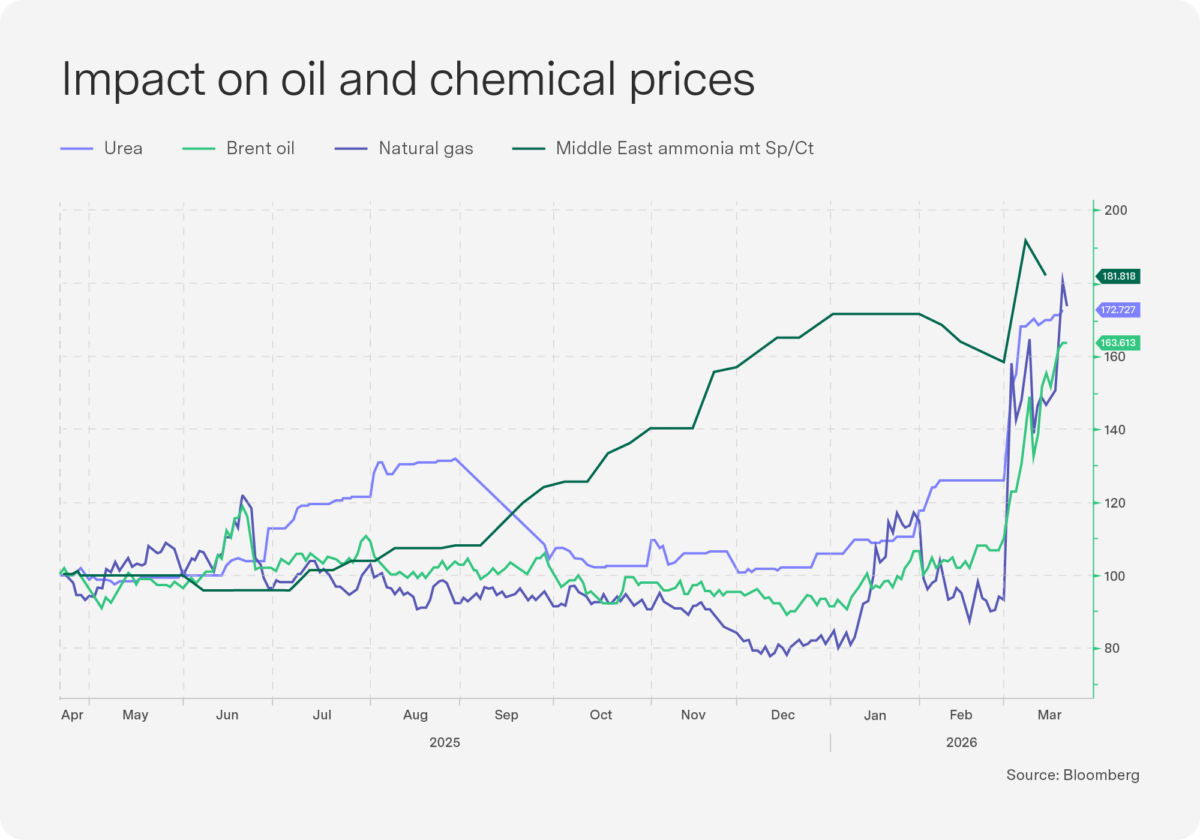
JPM research shows energy prices close to $100/bbl through midyear (moderating towards $80/bbl thereafter), which would raise consumer prices by 1.0% and reduce growth by 0.8%. But the disruption extends well beyond crude oil. The Strait of Hormuz also carries critical flows of chemical and petrochemical products whose supply impairment has global implications for food, agriculture and semiconductor manufacturing. To place this in historical context: the Strait of Hormuz remained open during both the Gulf War (1990) and the Iraq War (2003). The closest historical analogue is Russia’s invasion of Ukraine in 2022, which disrupted the Black Sea, a critical corridor for grain and fertiliser. Around 50% of the world’s seaborne sulphur trade passes through the Strait of Hormuz; sulphuric acid is a key input in wafer cleaning and microchip fabrication. The price of urea – the world’s most widely used nitrogen fertiliser – has risen 70% since the conflict began, and ammonia is up 80%. Furthermore, the Middle East supplies approximately one-third of the world’s commercial helium, which is essential for semiconductor manufacturing equipment. We cover the implications of this in each of the country sections.

Delisting from the JSE: What do the data tell us? Part 1
The Association for Savings and Investments South Africa (ASISA) commissioned me to investigate the challenge – omnipresent in the media – of delistings from the Johannesburg Stock Exchange (JSE). The full report is listed at the end of this Sygnals insert, but I intend to provide our readers with a two-part overview of the key results from the study.
Firstly, though, let’s start with some simple but crucial definitional distinctions: a new listing is when a company joins an exchange; a delisting is when a company leaves it; net new listings is the balance between the two and is actually the core indicator. We cannot be interested in delisters alone – we need full information on entries and exits from an exchange. We must also consider the size of the companies involved, not just the number. Losing three very small companies with a market capitalisation of R5 billion against the entry of one firm with a market cap of R200billion is a gain in the net listings rate by market cap. So market capitalisation is our preferred method for measuring delistings from the JSE relative to other exchanges around the world.
The headline result from our comparative analysis is stark. On a simple count basis, the JSE has underperformed global peers for a long time. Over the period 1993–2015, the JSE’s mean delisting rate was 7.8%, versus 4.1% for global exchanges. Even when we include new listings, the net listing rate for the JSE is -3.8%, compared with 0.4% globally. So over the full period 1993-2015 (unfortunately we don’t have more recent data!), more firms left the JSE than joined it, while the average global exchange at least held its ground over the same period.
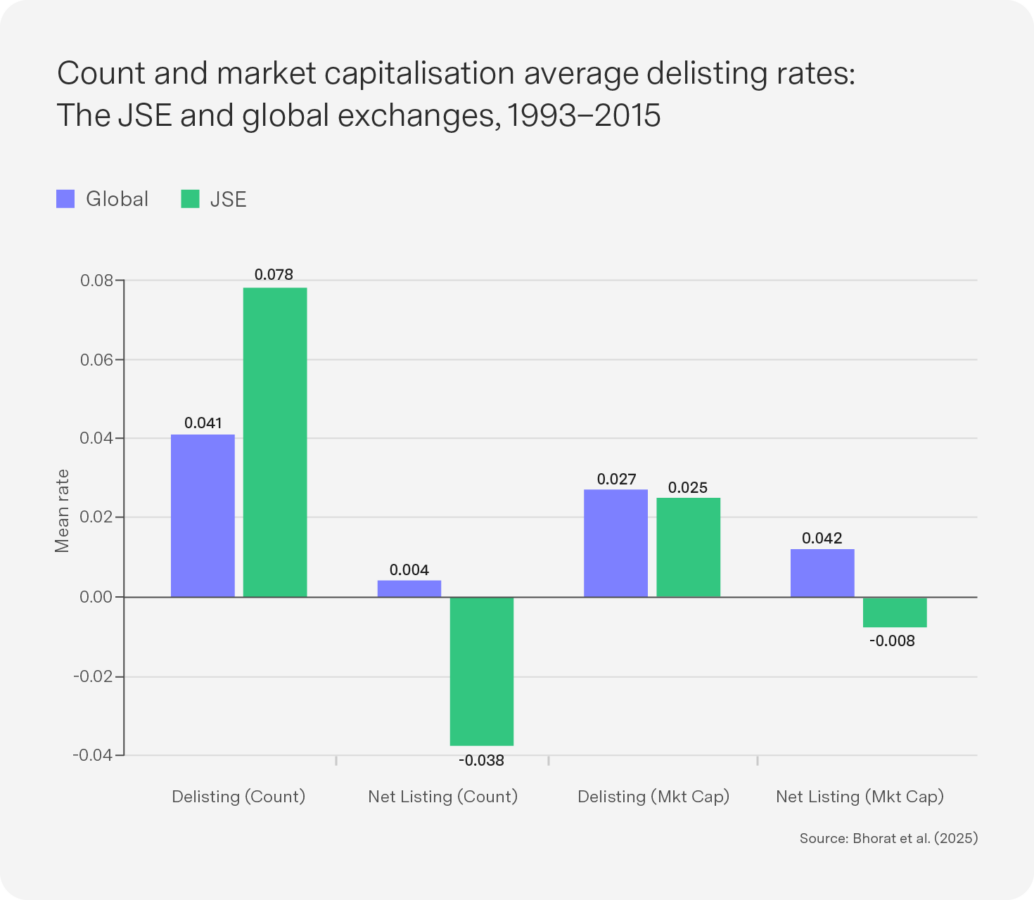
The JSE also underperforms if we compare the value of firms rather than the number of firms. The global exchanges show a positive mean net new listings rate by market capitalisation of 1.2%; the JSE, by contrast, records -0.8%. So there was a net outflow of listed equity in value terms from the South African exchange over the period, even after adjusting for firm size. The exchange not only lost firms over this period, it lost capital in net terms. This is probably the most important comparative result in the paper, indicating that the JSE’s problem is not cosmetic – it is not just that smaller companies are disappearing while the bigger ones stay intact. The new market as a whole has not matched the value of the exiting firms.
An important wrinkle in the results is that when examined by market cap alone, the JSE has a delisting of 2.5%, marginally lower than the global 2.7%. This suggests that while South Africa has been losing more companies than the average exchange, those firms have often been relatively small in value terms. A key weakness lies not only in delistings but in the failure to attract sufficiently large new listings to offset them.
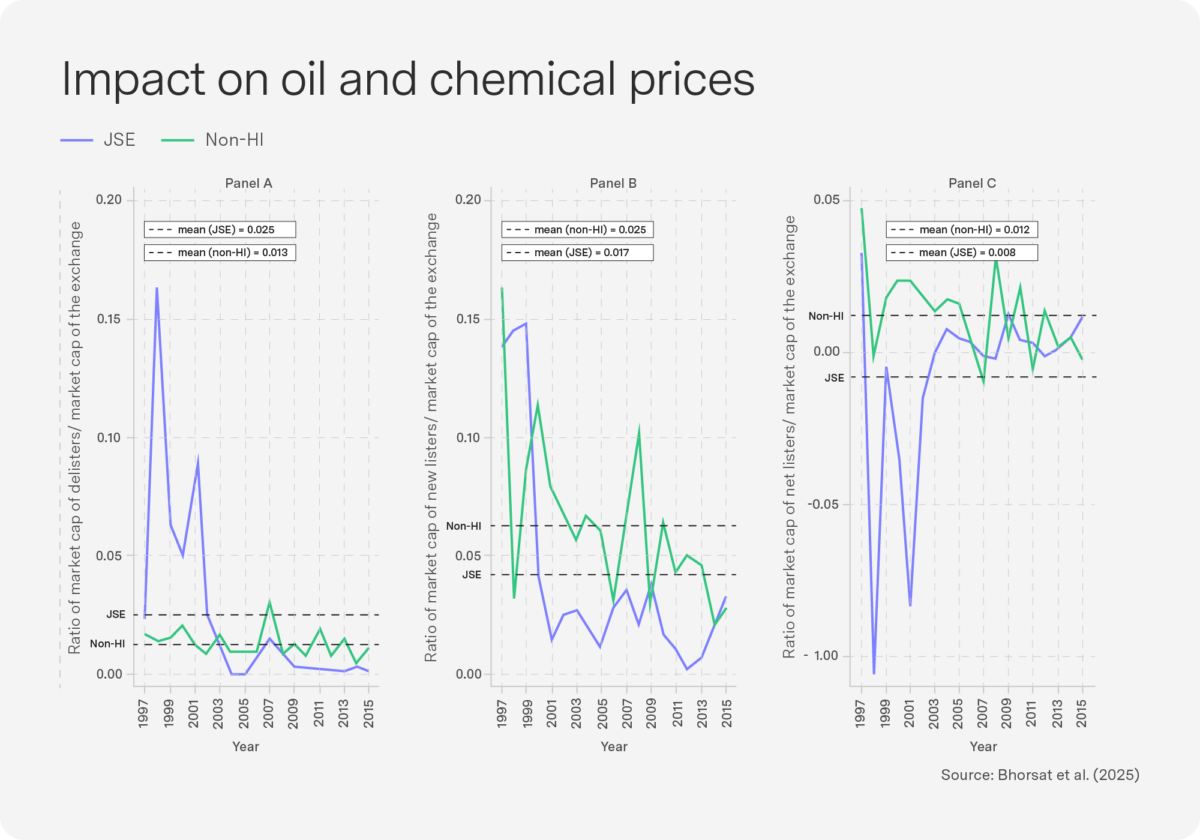
In the study, we tried to distinguish between exchanges in industrialised versus emerging markets. We thus re-estimated the delisting indicators of the JSE against a sample of high-income and non-high-income country exchanges. The JSE performs poorly on count measures against high-income exchanges, with a higher delisting rate and much weaker net listing performance. The market-cap comparison softens, but it does not change the higher delisting rates on the JSE relative to industrialised country exchanges. More troubling is the comparison with non-high-income exchanges. One might expect the JSE, as Africa’s premier bourse, to compare more favourably with peers at a similar stage of development, but it does not. Our paper finds that the JSE underperforms non-high-income exchanges across the board. On a market-cap basis, the non-high-income sample records a marginally positive and relatively stable net new listings rate of 1.2%, while the JSE remains negative at -0.8%. On average, South Africa underperforms over the 1993–2015 period relative to peers in terms of enticing local and global firms to seek capital on our public stock exchange. This sobering result means the JSE’s (and South African economy’s) underperformance cannot simply be explained away by the notion that emerging markets are riskier investment environments. The evidence suggests that, on average, South Africa did worse on this metric over the 1993-2015 period than both richer and poorer peers.
What should we conclude from all this? First, the delisting problem is real – but the net listings problem is bigger. The JSE’s challenge is not just that firms leave, it is that too few – and too few large ones – replace them. Second, the count measure and the market-cap measure tell different stories, but both matter. The count measure tells us about breadth: the number of firms, the diversity of the market, the pipeline of entrepreneurial activity. The market-cap measure tells us about depth: the value of listed equity, the capacity of the exchange to remain a serious platform for capital formation. The JSE looks weak on both: breadth and depth. Third, the fact that the JSE’s market-cap underperformance is less severe than its count underperformance suggests a market increasingly anchored by a smaller number of large firms, while smaller companies steadily disappear. This thinning ecosystem could speak to South Africa’s longer-term challenge of low growth, of policy missteps or of the availability of alternative forms of capital outside of a listed bourse. In Part II next month, I will use a combination of quantitative and qualitative evidence to examine these and other factors that have shaped and influenced the JSE delisting trend. Stay tuned!

Top-performing Sygnia funds
Equity, currency and bond markets have sold off sharply as carry trades unwind. The dollar has strengthened and gold has softened. This pushed funds with high levels of dollar cash into the top position over one month. Despite being equity, Berkshire Hathaway showed its defensive tilt, as it has a lot of cash on its balance sheet.
Despite emerging markets (EMs) and South Africa having a very tough month as the virtuous cycle of EMs came to an end, they are still top over 12 months.
1-month absolute performance as at 30 March 2026
- Skeleton Global Cash Fund 8.4%
- Sygnia OSI Fund 7.4%
- Skeleton Global 30 Fund 4.2%
- Skeleton Global 50 Fund 2.3%
- Sygnia Life Berkshire Hathaway Portfolio 1.4%
12-month absolute performance as at 30 March 2026
- Sygnia Itrix MSCI Emerging Markets 50 ETF 33.3%
- Sygnia Itrix Top 40 ETF 32.3%
- Sygnia Top 40 Index Fund 31.5%
- Sygnia Listed Property Index Fund 26.7%
- Sygnia Divi Index Fund 26.7%

US: Insulated but not immune
The Federal Reserve held rates steady at its March meeting, but the more important signal came from its revised projections and from Fed Chair Jerome Powell’s tone in the press conference, where he expressed frustration at the slow pace of inflation moving closer to target. The updated Summary of Economic Projections reflects an inflationary tilt. The 2026 personal consumption expenditure (PCE) inflation forecast was revised up 30 basis points (bps) to 2.7%. The dot plot continues to show a single 25 bps cut in 2026 and another in 2027, consistent with December. In a supply-shock environment in which energy and food prices are rising, the Fed is likely to hold rates steady for longer than the dot plot implies, with upside risk to the rates path if the Hormuz disruption proves more persistent than markets are currently pricing.
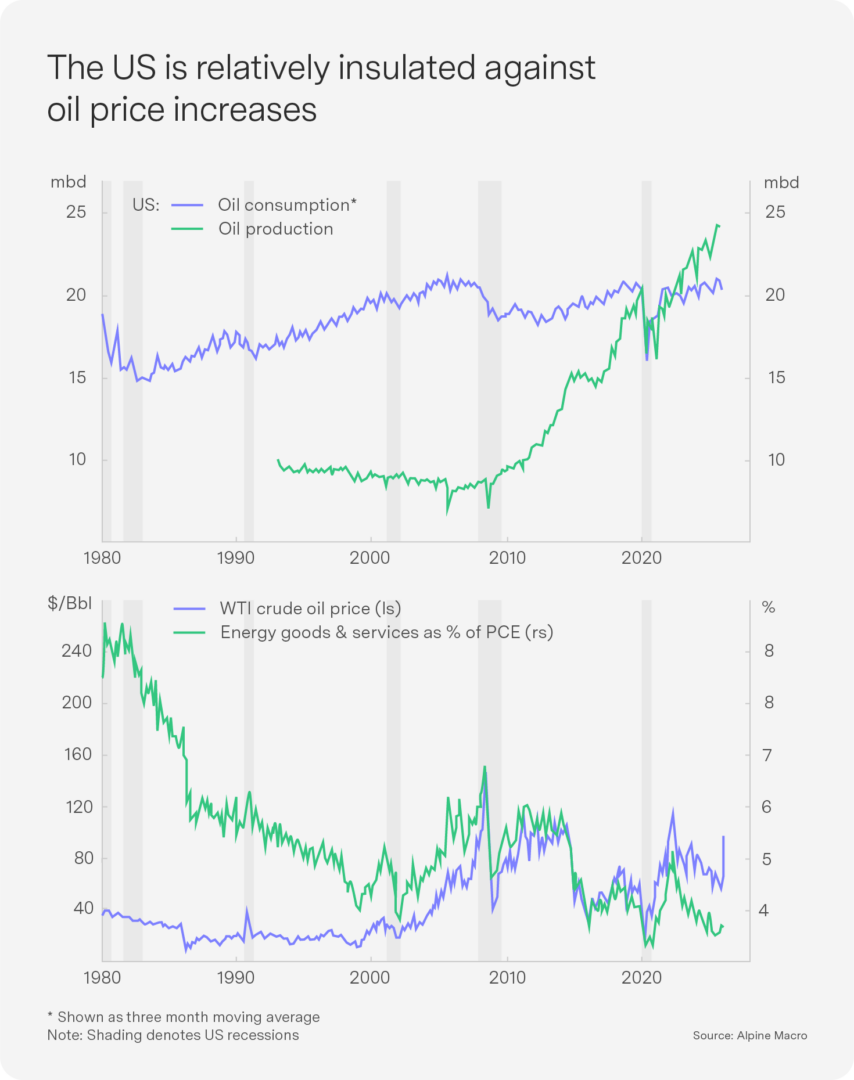
The US is most protected from this shock, as dollar strength dampened imported inflation for the US, growth coming into the shock was stronger than peers, the US is a net energy exporter and American WTI oil is trading $20/bbl cheaper than Brent crude. Energy goods and services as a share of US PCE have more than halved over the past 50 years (see Chart 4). Europe is materially more exposed, as currency weakness provides less of a cushion against dollar-denominated commodities, and the region is bearing the primary burden of the sharp rise in natural gas prices. Energy costs account for about 11% of household income in Europe, compared with 3.4% in the US. We have reduced our eurozone bond allocation to neutral.
Beyond oil, risks remain on tariffs. The Trump administration has announced a detailed trade probe into more than a dozen economies, setting the stage for a new round of tariffs following the Supreme Court’s striking down of the administration’s earlier levies. Trump may be forced to delay implementation until the Middle East crisis has calmed down.

China: Growth downgraded but domestic activity improving
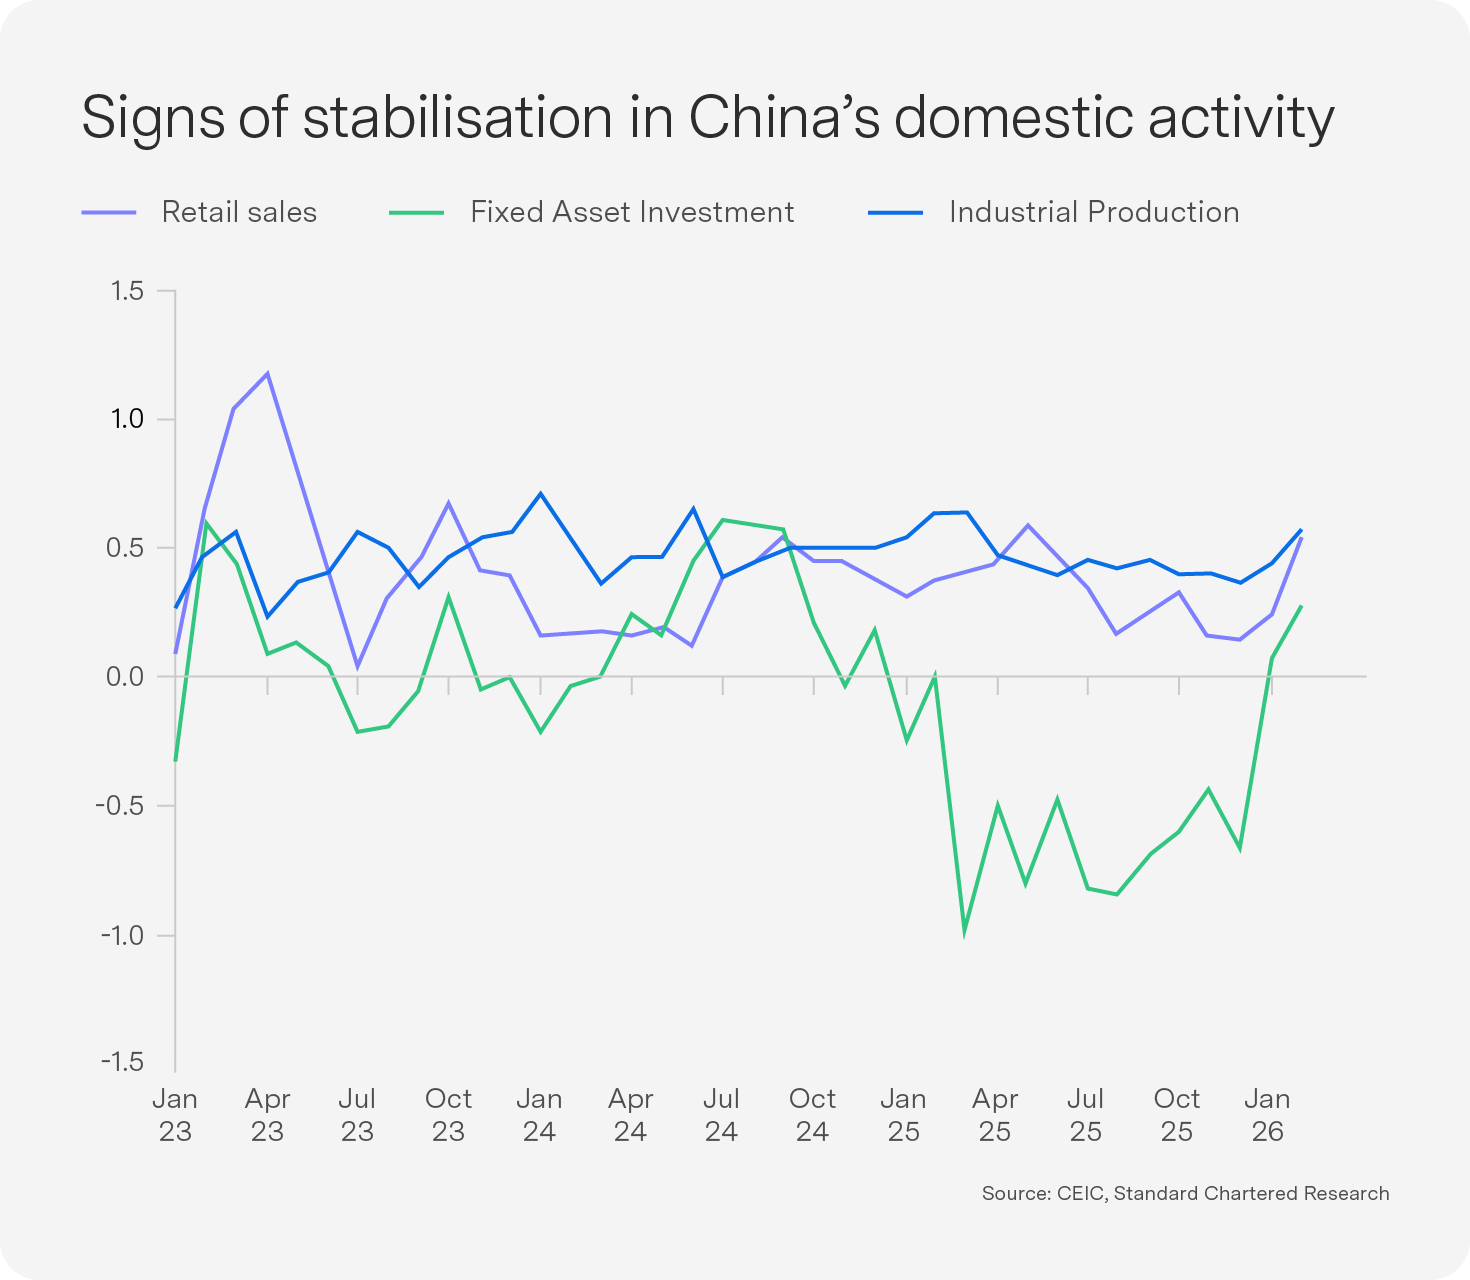
Premier Li Qiang presented the Government Work Report at the opening session of the National People’s Congress on 5 March. China’s growth target for 2026 has been lowered to 4.5–5.0%, its lowest target since 1991. China’s economy has shown broad-based recovery: January–February domestic data suggesting a stabilisation in domestic demand led by a sharp turnaround in investment and retail sales. China’s exports surprised to the upside in the first two months of 2026, with growth jumping to 21.8% year-on-year in January–February, well ahead of the market consensus of 7.2%. The US Supreme Court’s ruling reduced US tariffs on China, and the imposition of lower Section 122 tariffs will also likely reduce the drag on growth.
Oil imports account for only around 2% of GDP, and the economy’s oil intensity has declined dramatically over recent decades, making China significantly less sensitive to oil price fluctuations than in earlier years. While China is relatively protected, the rest of EMs face a severe negative impact Major EM economies are oil importers, whose households spend a higher share of consumption on transport and food than do developed markets. Immediate currency weakness has already raised inflation expectations, and EM central banks are being forced into rate hikes even as growth deteriorates. The combination of a stronger dollar, higher inflation, rising rates and deteriorating risk sentiment creates a deeply adverse environment for EM assets. We have reduced our EM bond and equity overweight to neutral.

Outlook uncertain – positions cut back to neutral
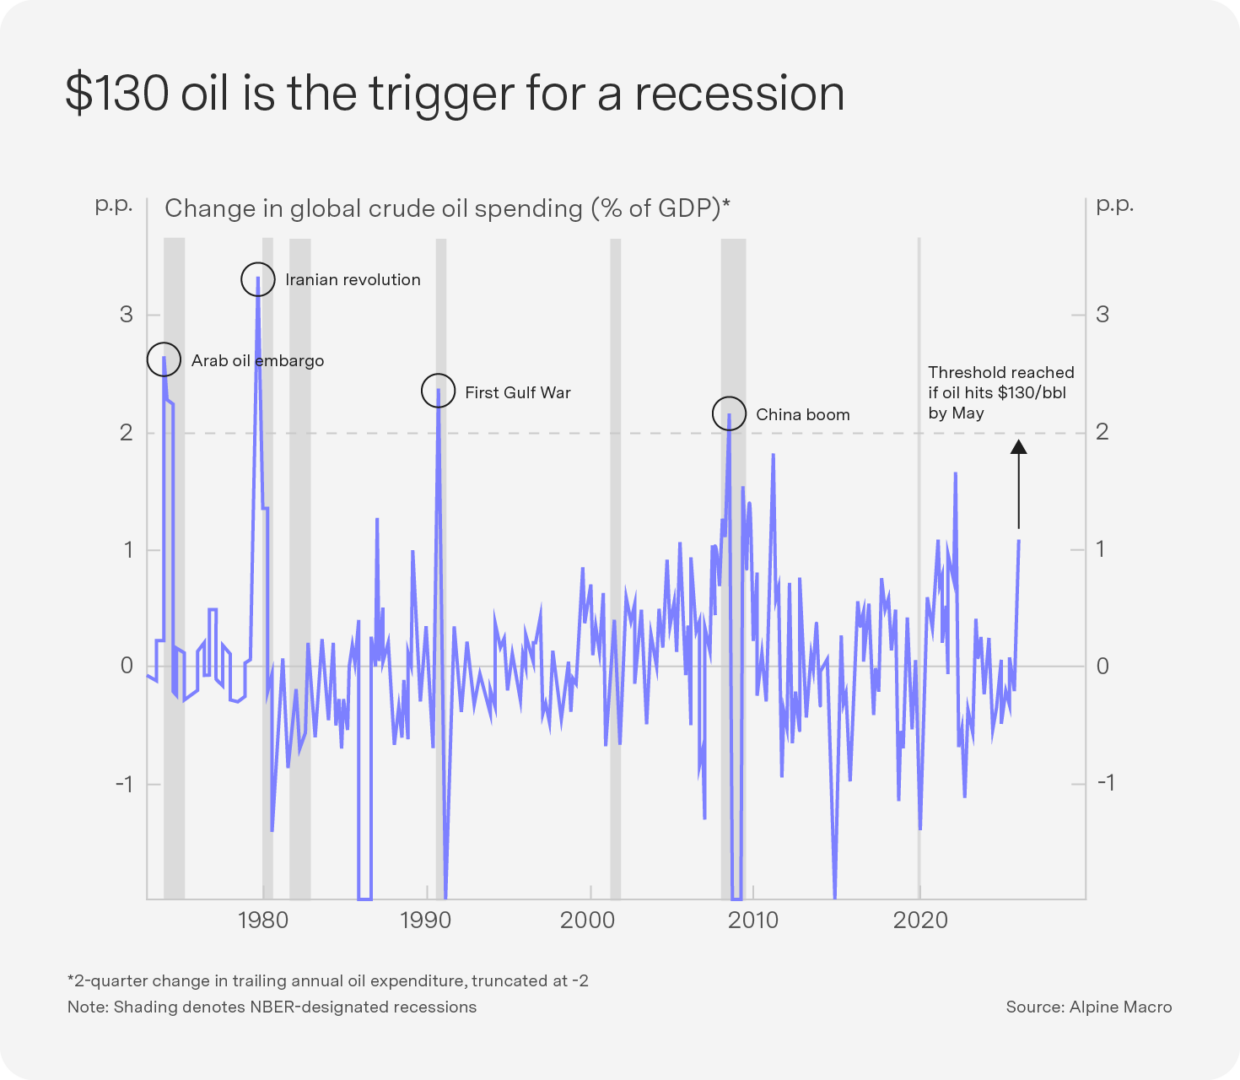
From a cyclical perspective, the key question is whether the oil shock will trigger a major global downturn. The answer will ultimately depend on the magnitude and duration of the energy shock. Historically, a sustained doubling of oil prices to around $130 for two months has been the threshold for a recession (see Chart 6).
The US has strong incentives to seek a relatively swift resolution to the conflict in the Middle East – though as a net oil exporter, the recent spike in prices is largely redistributive rather than outright contractionary for its economy. The world’s two largest economies are likely to remain reasonably resilient to an oil shock, providing an important anchor for the global economy. Even if a ceasefire happens immediately, it will take time for supply to return to the Strait. Given the uncertainty of the outlook, we have reduced our overweight in EMs back to neutral, including South African equities.
South Africa is heavily dependent on energy and fertiliser imports, leading the rand to weaken materially. Rate expectations have shifted from pricing in nearly three cuts over the next twelve months to pricing in three hikes. If oil is sustained at $90/bbl and the USD/ZAR at 17.00 for three months, JPMorgan models headline CPI above 4.1% by June. Gold’s failure to make new highs during this conflict represents an additional downside risk to South African equities, as precious metals make up one third of the Top 40 Index.
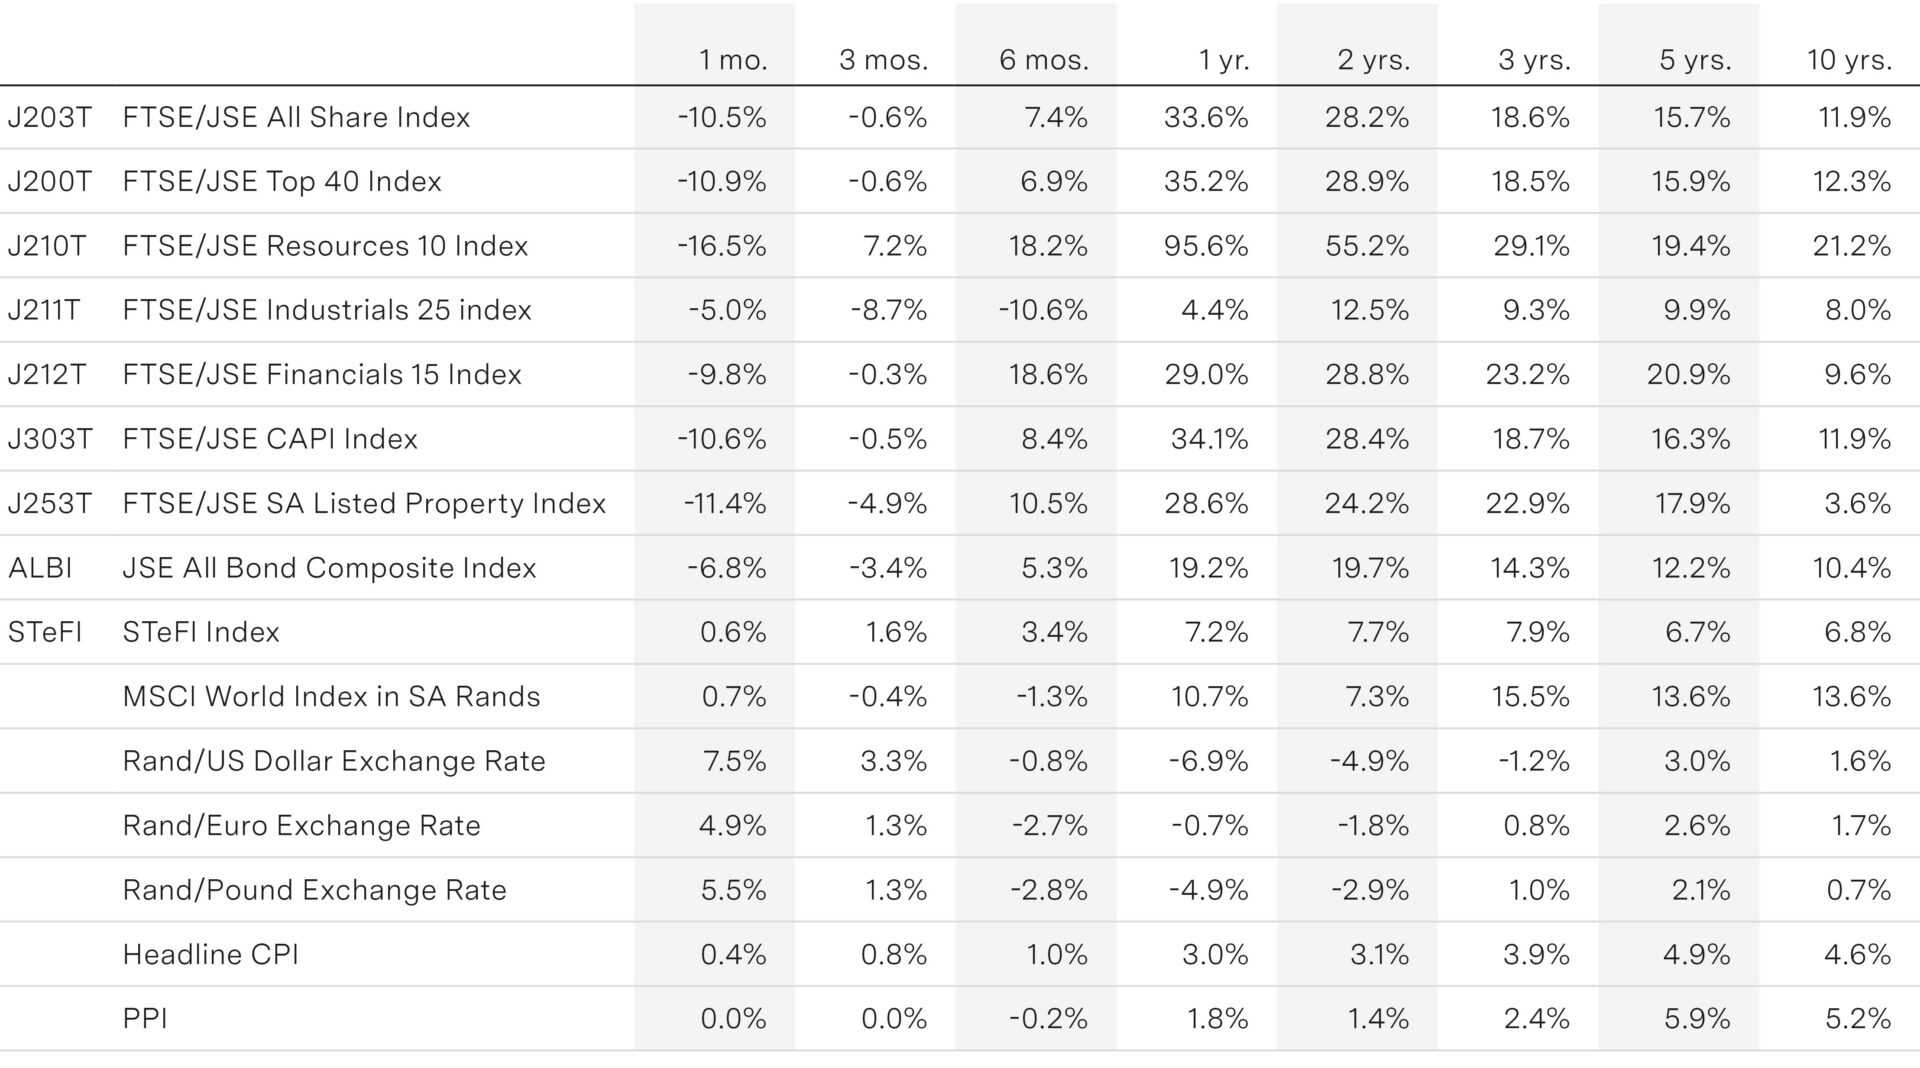
Key indicators