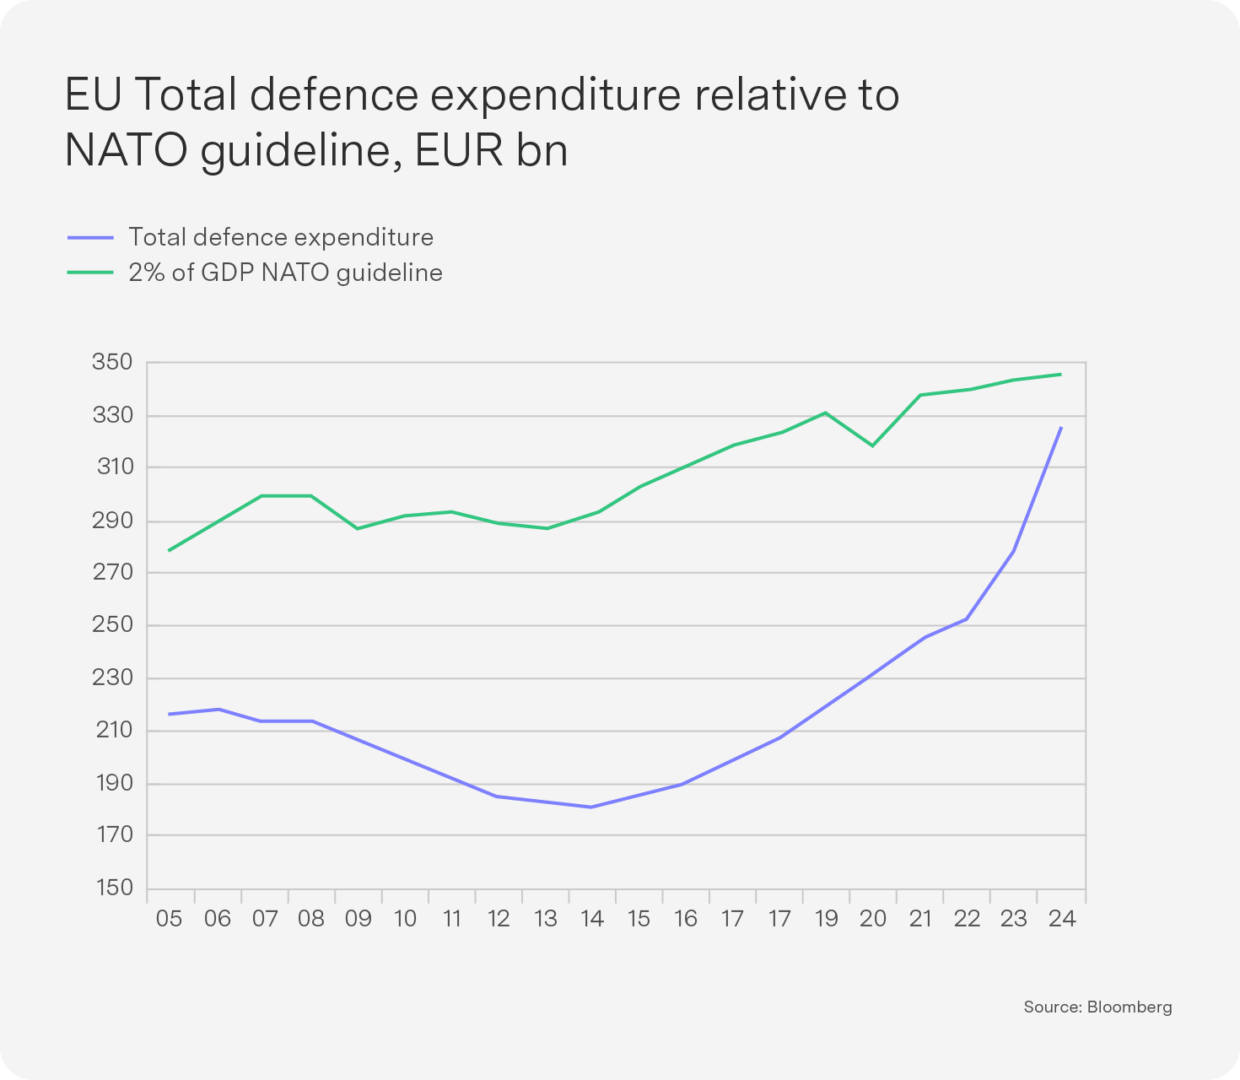
New world order: The transatlantic defence alliance is over
The dominant theme for financial markets in February has shifted from AI and tariffs to the potential US-led Russia-Ukraine ceasefire. America’s recent pivot toward Russia is redefining the transatlantic defence alliance. After Trump spoke to Putin without giving notice to European officials, the European Union (EU) is realising it may be on its own. “Look, we have an ocean in between. They don’t,” Trump said. US Defense Secretary Pete Hegseth said the US will not supply troops to a peacekeeping force and Ukraine should not expect to join NATO or recapture all the territory it has lost since 2014. Hegseth added that NATO will prosper so long as its European members play their part: “It will require our European allies to step into the arena and take ownership of conventional security on the continent.”
Bloomberg Economics estimates that the cost of supporting Ukraine will push the aggregate EU defence budget toward 3.5% of GDP, nearly double its current level. If financed by debt, this would add an additional $2.7 trillion to the five largest European NATO members’ borrowing needs over the next decade. Some in the EU see this moment as an opportunity for greater independence away from the US. Denmark announced its biggest military investment in half a century, with military expenditure rising from 2.4% of GDP in 2024 to 3.2%. “We have one message for the defence chief: buy, buy, buy,” Prime Minister Mette Frederiksen said. UK Prime Minister Keir Starmer announced plans to increase UK defence spending to 3% of GDP over the next decade by cutting overseas development spending. Existing coalition governments in the two largest EU countries pose a challenge. Macron says Europeans should forge ahead without the US, but he is struggling to build consensus in France. In Germany, Friedrich Merz’s Christian Democrats (CDU) and sister party CSU won Germany’s elections. Within hours of the polls closing, Merz had declared that Germany must fundamentally remake its security arrangements and achieve “independence” from the US. Friedrich Merz is said to have opened talks with the Social Democrats to quickly approve as much as €200 billion ($210 billion) in special defence spending. However, it remains unclear whether Merz can negotiate a majority strong enough to drive through fundamental reforms.
Although the timing and details of a deal remain uncertain, Polymarket has indicated a 47% probability of a ceasefire in Ukraine by July. The US-led ceasefire proposal currently stipulates: Ukraine to hold elections before some stages of talks; occupied territory to remain under Russian control; US sanctions to be lifted on Russia; the EU to commit to additional military spend from the US; and a US minerals deal to be completed with Ukraine. The ceasefire for the euro area has been largely priced in year-to-date, with a sharp decline in German gas prices, strong outperformance of euro area equities and a strengthening of the EUR/USD. This has been a challenge to our thematic US exceptionalism, but a lasting ceasefire without the Ukraine’s buy-in will be difficult to sustain.
While tailwinds are forming for EU markets, including lower European Central Bank policy rates and a potential de-escalation between Ukraine and Russia, substantial headwinds remain. These include that the EU has a sizable trade surplus with the US and is likely to be on Trump’s hit list for tariff hikes, the EU’s equity market is heavy in industrial stocks and could continue to be held back by China’s growth slowdown, and Germany has limited room for fiscal stimulus even after the elections with the debt brake, which limits the government borrowing to 0.35%, enshrined in the constitution. Furthermore, turning down Trump and Putin’s ceasefire offer could drive another wedge between the EU and US. We maintain our underweight EU.
Trump’s measure of success in his new world order policies

Analysing the market impact of Trump’s approach to the global economic stage hinges on understanding his measures of success. Treasury Secretary Scott Bessent provided insight into the key measure when he highlighted the “3-3-3” plan aimed at lowering the US 10-year yield:
- Reduce the budget deficit to 3% from over 6% of GDP.
- Increase oil production by 3 million barrels per day.
- Sustain 3% economic growth through higher corporate investment to replace government investment by making the 2017 Tax Cuts and Jobs Act permanent.
These are great objectives, but they present conflicting challenges. Implementing further tax cuts is likely to increase the deficit. The US House of Representatives passed a budget that includes $4.5 trillion in tax cuts by extending the 2017 Trump tax cuts, $2 trillion in spending cuts focused on Medicaid and other health programmes, increased funding for defence and border security and a $4 trillion increase in the debt ceiling.
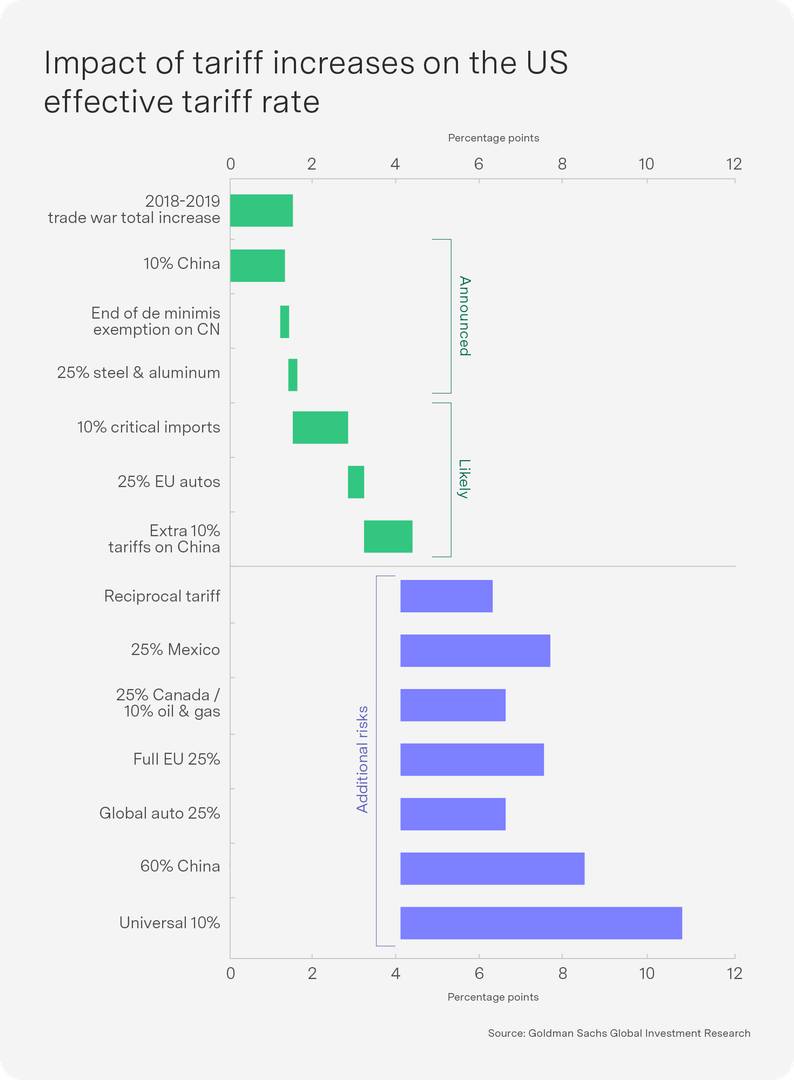
Achieving lower inflation and sustained growth may be hindered by factors such as reduced immigration and increased tariffs. Since taking office, Trump has threatened numerous tariffs, though only a few have been implemented to date – including a 10% tariff on Chinese imports. Upcoming deadlines loom for broader tariffs and are a risk to markets either indirectly through reduced confidence or directly through implementation at higher levels than expected.
- 25% broad tariffs on imports from Mexico and Canada: These tariffs are set to take effect on 4 March, with knock-on effects ranging from the Petersen Institute’s estimation of a potential -0.1% impact on US GDP and a 0.5% increase in inflation to Bloomberg’s forecast of a -1.2% decrease in GDP and a 0.7% increase in core personal consumption expenditure. An additional 10% tariff on Chinese imports will also take effect on this date.
- 25% tariffs on steel and aluminium: This tariff will come into effect on 12 March, affecting major suppliers like Mexico and Canada.
- Reciprocal restrictions: Trump plans to impose restrictions on trading partners that levy tariffs on US exports as soon as 1 April.
- Potential new tariffs: Additional tariffs on pharmaceuticals, semiconductors and automobiles may also be announced in early April.
In terms of immigration policy, Trump is likely to focus more on visible measures than broader immigration reform, as immigrants have played a significant role in job growth, economic stability and inflation reduction. The labour force has seen an increase of over 5 million foreign workers since the pandemic, with immigrants now comprising nearly one in five US workers. Strictly restricting immigration will reduce growth and push up inflation.
Ultimately, Trump will likely monitor the 10-year Treasury yield closely to gauge the effectiveness of these conflicting policies and adjust his approach as necessary. This responsiveness could be beneficial for market stability.
To increase VAT or not to – that is the question

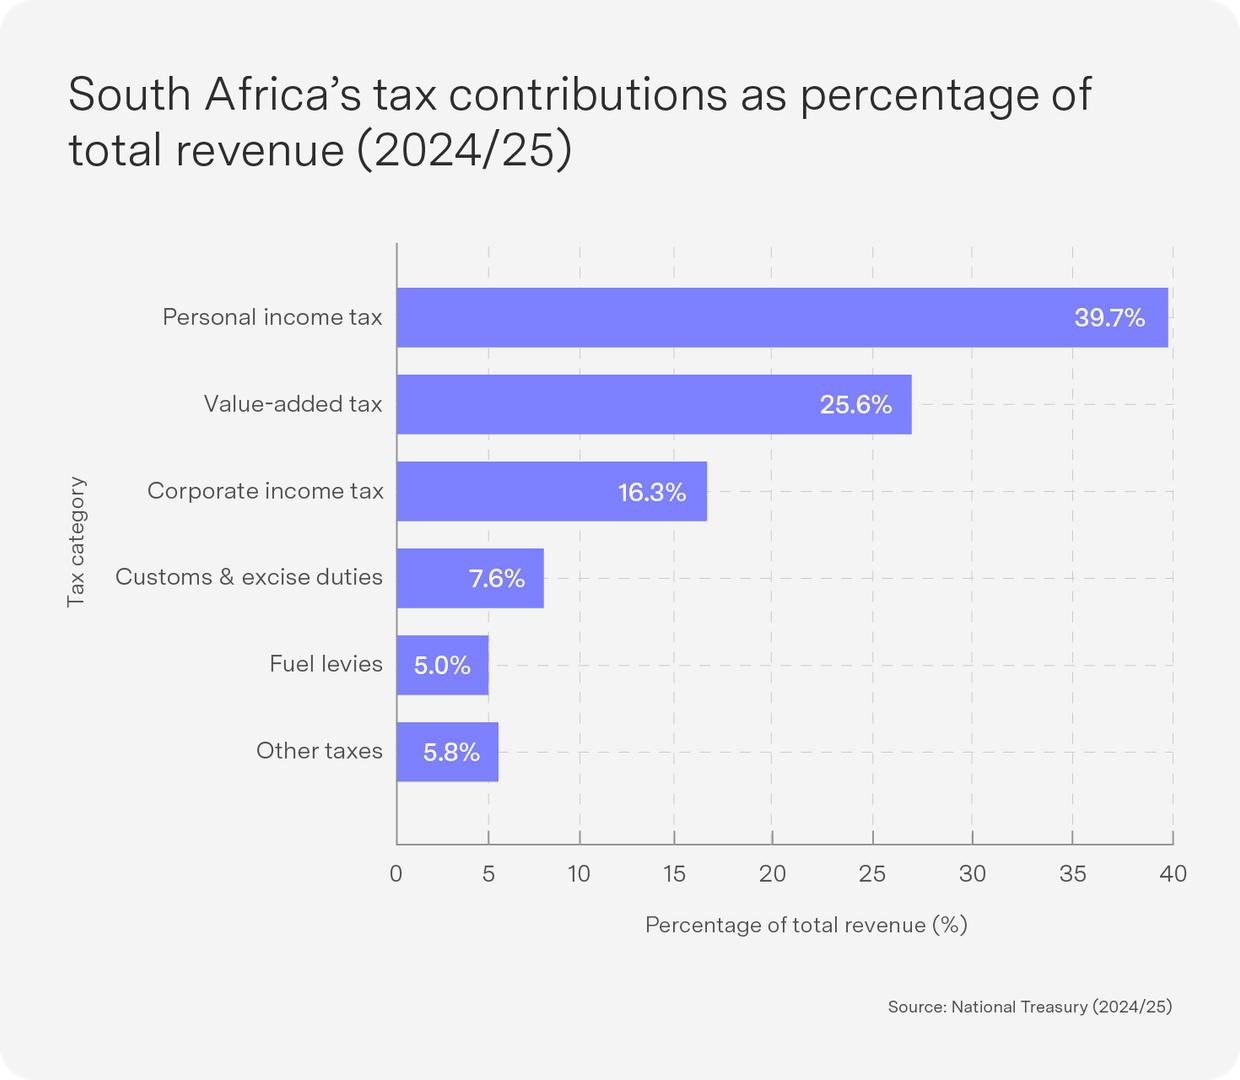
One of the worst kept Budget secrets in recent times – perhaps a sign of the challenges of an undisciplined government of national unity (GNU) – was the proposed VAT increase from 15 to 17%. This was viewed as necessary to raise an additional R58 billion of revenue to finance expenditures not accounted for in the previous budget – mainly to cover the extension of the social relief of distress grant (SRD) and an additional 1 percentage point increase in the public sector wage bill from 4.5% to 5.5%.
VAT is the second most important source of revenue in South Africa. As the graphic below shows, a quarter of total tax revenue in South Africa comes from VAT payments – sandwiched between personal income tax (40%) and company tax (16%). The outcry around an increase has often hinged on the assumption that VAT is regressive, but careful assessment of the data – based on a World Bank study in 2016 and an updated study in 2018 – shows the opposite. When zero-rated goods are included, VAT is in fact mildly progressive, meaning the tax hike would be pro-poor in nature, albeit by a very small margin. While it cannot be regarded as a redistributive tool, the VAT increase, based on this study, is at worst distributional-neutral. Furthermore, the proposed increase was accompanied by a widening of the basket of zero-rated goods, which would have further supported the progressive nature of the increase.
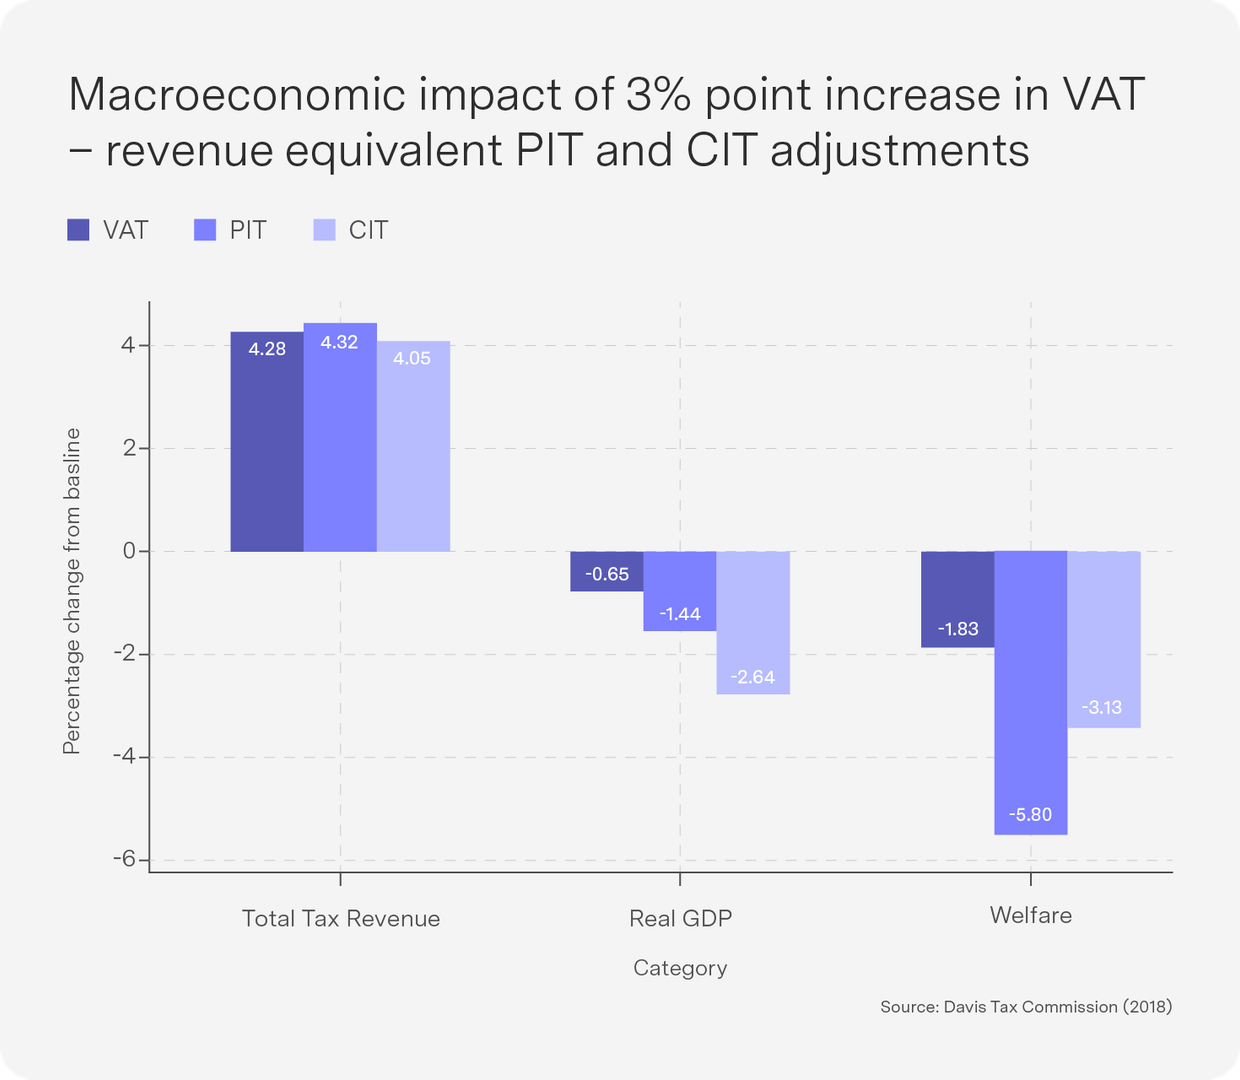
In a 2018 report, the Davis Tax Committee considered the impact of a hypothetical VAT increase of 3 percentage points on economic growth, revenue and household expenditure. The increase was compared to revenue-target-equivalent personal income tax (PIT) and company income tax (CIT) increases. The report found that the highest revenue generation (based on leakage estimates) would come from VAT and that GDP would contract the least with the VAT change (CIT yielded the greatest GDP reduction, of about 2.5%). In turn, the impact on household welfare – measured by the expenditure effect – was most negative for PIT and CIT.
In other words, households’ net income was modelled as least negatively affected by a VAT increase. This offers a clear insight into why National Treasury preferred a VAT increase over PIT or CIT increases: VAT reduces growth and household expenditure the least and generates the highest gross revenue. I raised another caution about raising PIT in the October 2024 Sygnals, because revenue from the last income tax hike for top earners led to a decline in revenue from this tax bracket. Read slowly: VAT is not regressive and is the least of the three tax hike evils that Treasury has available to it!
Ultimately, however, the onus is on the Minister of Finance to cover the R58 billion additional expenditure and resolve this budgetary impasse. To do this, the above evidence could be carefully and deliberately circulated amongst Cabinet colleagues, which could lead to horse trading around a new – lower – VAT increase. National Treasury could also consider deeper expenditure cuts in politically less sensitive areas. Alternatively, the government could go back to the credit markets to raise more debt. The first two are probably the only realistic options available to National Treasury, as Minister Godongwana is highly fiscally responsible and is unlikely to deviate from the consolidation path.
This would then leave a politically viable solution to negotiate a lower VAT increase and expenditure cuts elsewhere or a pure R58 billion cut in expenditure commitments. Treasury officials are no doubt re-examining where excessive spending is occurring in the state apparatus – with easier cuts being to dominant government institutions where a percentage deduction here and there could be tolerated. A larger, long-term job is to identify and shut down moribund and expensive government-linked bodies, allied with a much more concerted effort to reduce fruitless and wasteful expenditure. The 2024 Auditor-General’s report found that such expenditure amounted to about R30 billion in 2024 alone – more than half the needed funds in the 2025/2026 budget.
As we approach the new Budget date, we will see either a complete withdrawal of the VAT increase – and thus significant expenditure cuts amounting to R58 billion – or a smaller VAT increase and more modest expenditure cuts. The harsh lesson from one long Budget year to the next is this, however: we are walking a very long, narrow fiscal tightrope to lower debt-to-GDP ratios – with very little room for error.
Top-performing Sygnia funds

The China ETF was the top performer over one month, driven by the surge in Chinese tech stocks and the DeepSeek R1 announcement in January, Alibaba’s excellent results in February and Xi Jingping’s stated support of the private sector. This drove emerging markets and Naspers/Prosus, which in turn drove South African equities. Berkshire Hathaway was the only US fund in the top 5 after another set of great results. Notably, Berkshire Hathaway sold its S&P 500 passive holdings and raised cash to a record level of nearly $350 billion.
1-month absolute performance as at 27 February 2025
- Sygnia Itrix MSCI China Feeder ETF: 14.7%
- Sygnia Itrix MSCI Emerging Markets 50 ETF: 4.9%
- Sygnia Life Berkshire Hathaway Portfolio: 3.8%
- Sygnia Top 40 Index Fund: 3.1%
- Sygnia Transnational Equities Fund: 2.8%
The FANG.AI fund won two 2025 Raging Bull awards! The fund has lost its top spot over 1 year but remains the only US fund in the top 5 over 12 months. The other four positions are held by emerging market funds, including China and South Africa.
12-month absolute performance as at 27 February 2025
- Sygnia Itrix MSCI Emerging Markets 50 ETF: 25.0%
- Sygnia Top 40 Index Fund: 24.9%
- Sygnia Itrix Top 40 ETF: 24.0%
- Sygnia Itrix MSCI China Feeder ETF: 23.1%
- Sygnia FANG.AI Equity Fund: 21.8%
US: growth slows while inflation remain sticky, mid-caps looking cheap

Growth is still solid but is slowing. The Atlanta Federal Reserve’s latest GDPNow model projects a 2.3% annualised increase in US real GDP for Q1 2025, down from a high of 3.9%, indicating a moderation in economic growth expectations. US January ISM services printed below expectations and retail sales were negative and also fell more than expected. Downside growth risks have increased as a result of a squeeze on household purchasing power from higher inflation and a softening in consumer confidence related to tariff concerns. However, employment remains resilient, with January unemployment falling to 4.0%, and growth should be supported by rising business sentiment.
Inflation remains sticky. The Michigan Survey of Consumers’ expectations for overall inflation over the next year jumped to 4.3% in February from 3.3% in January, and January’s US core CPI rose 3.3%, above expectations. Supercore inflation (core services less housing) surged 0.76% in January, its fastest acceleration in a year. The market shifted the expectation of the next Fed rate cut from September to December.
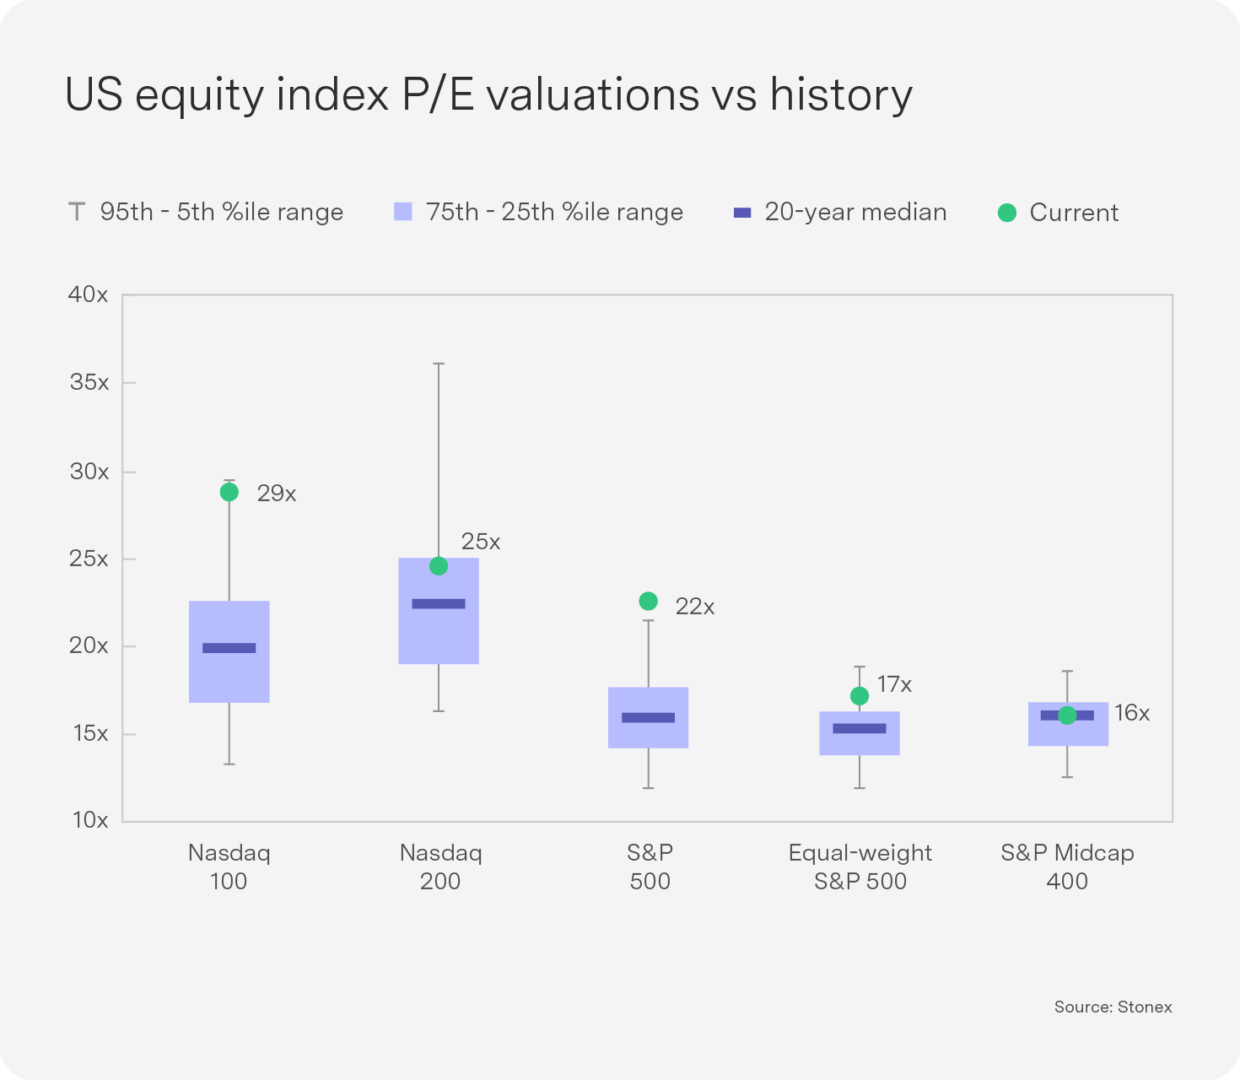
We remain overweight the US, but with a preference for US mid-caps, which should be supported as growth broadens on the back of higher business sentiment and reasonable valuations relative to the tech-driven Nasdaq 100.
The US is worst hit by its own policies because over two-thirds of US manufacturing firms are also importers, making them especially vulnerable to higher input costs on the back of tariffs. Supply chains will take years to realign, and businesses already face profit-margin compression. Concerns about weak sales are rising, which often signals an impending softening in the labour market. US policies that restrict companies’ ability to produce or sell abroad are also weighing on corporate profitability.
Some of the tariff-related costs will be passed on to consumers, keeping inflation higher for longer and limiting the Federal Reserve’s ability to cut rates on an absolute basis and relative to the rest of the world. The Fed chair has warned that the tariffs are “significantly larger than anticipated”, likely to result in higher inflation and slower growth. Trump’s public criticism of the Fed for not cutting rates added to market unease.
The US dollar has fallen to a three-year low against major trading partners, reflecting both weaker growth prospects and higher policy uncertainty and, ultimately, the erosion of US economic exceptionalism
Emerging markets: caught between tariffs and a capital goods import boom

BA capital spending boom is taking place across several Asian economies, driven by the global technology upcycle. South Korea and Taiwan in particular are benefiting from the demand for semiconductors and AI. The 20% surge in their capital goods imports augurs an acceleration in EM profit growth.
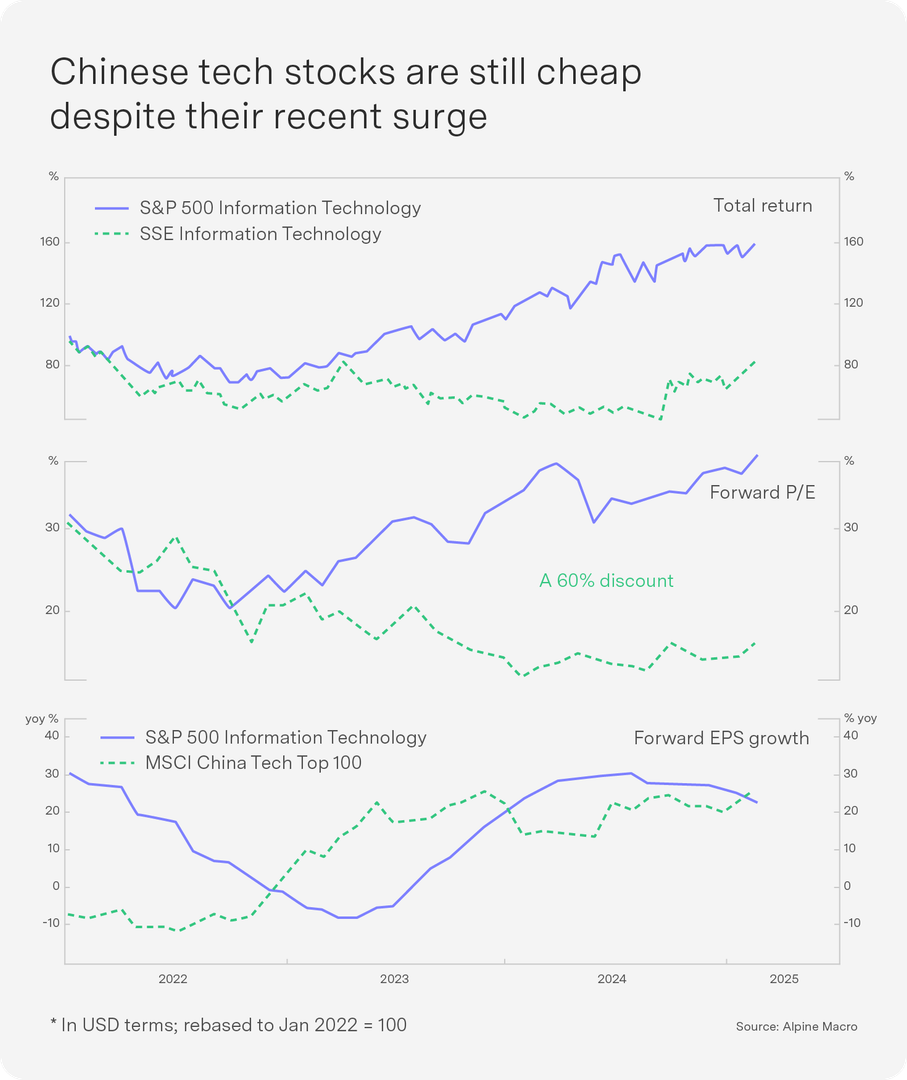
China should stop being a detractor from growth in 2025 as its property market stabilises. China’s aggregate financing was well ahead of estimates in January, at CNY7.06tn. Chinese technology stocks also surged on the back of the DeepSeek R1 model release, Alibaba’s Q3 revenue beating expectations and Xi Jinping’s meeting with Chinese business leaders, at which he pledged support for the private sector (a tactical shift in Chinese officials’ sentiment to private enterprise in China). Chinese tech stocks have underperformed the US and remain cheap despite the recent jump. However, Chinese equities remain susceptible to additional tariffs, US sanctions and blacklisting as the AI race heats up.
EMs are set for further monetary easing, which should bolster domestic growth as inflation readings continue to undershoot expectations, with most EM countries still reporting declines. The biggest threat to EMs remains tariffs, which could negatively affect business confidence and weaken EM currencies, causing the disinflation process to stall. We remain neutral EMs.
Outlook

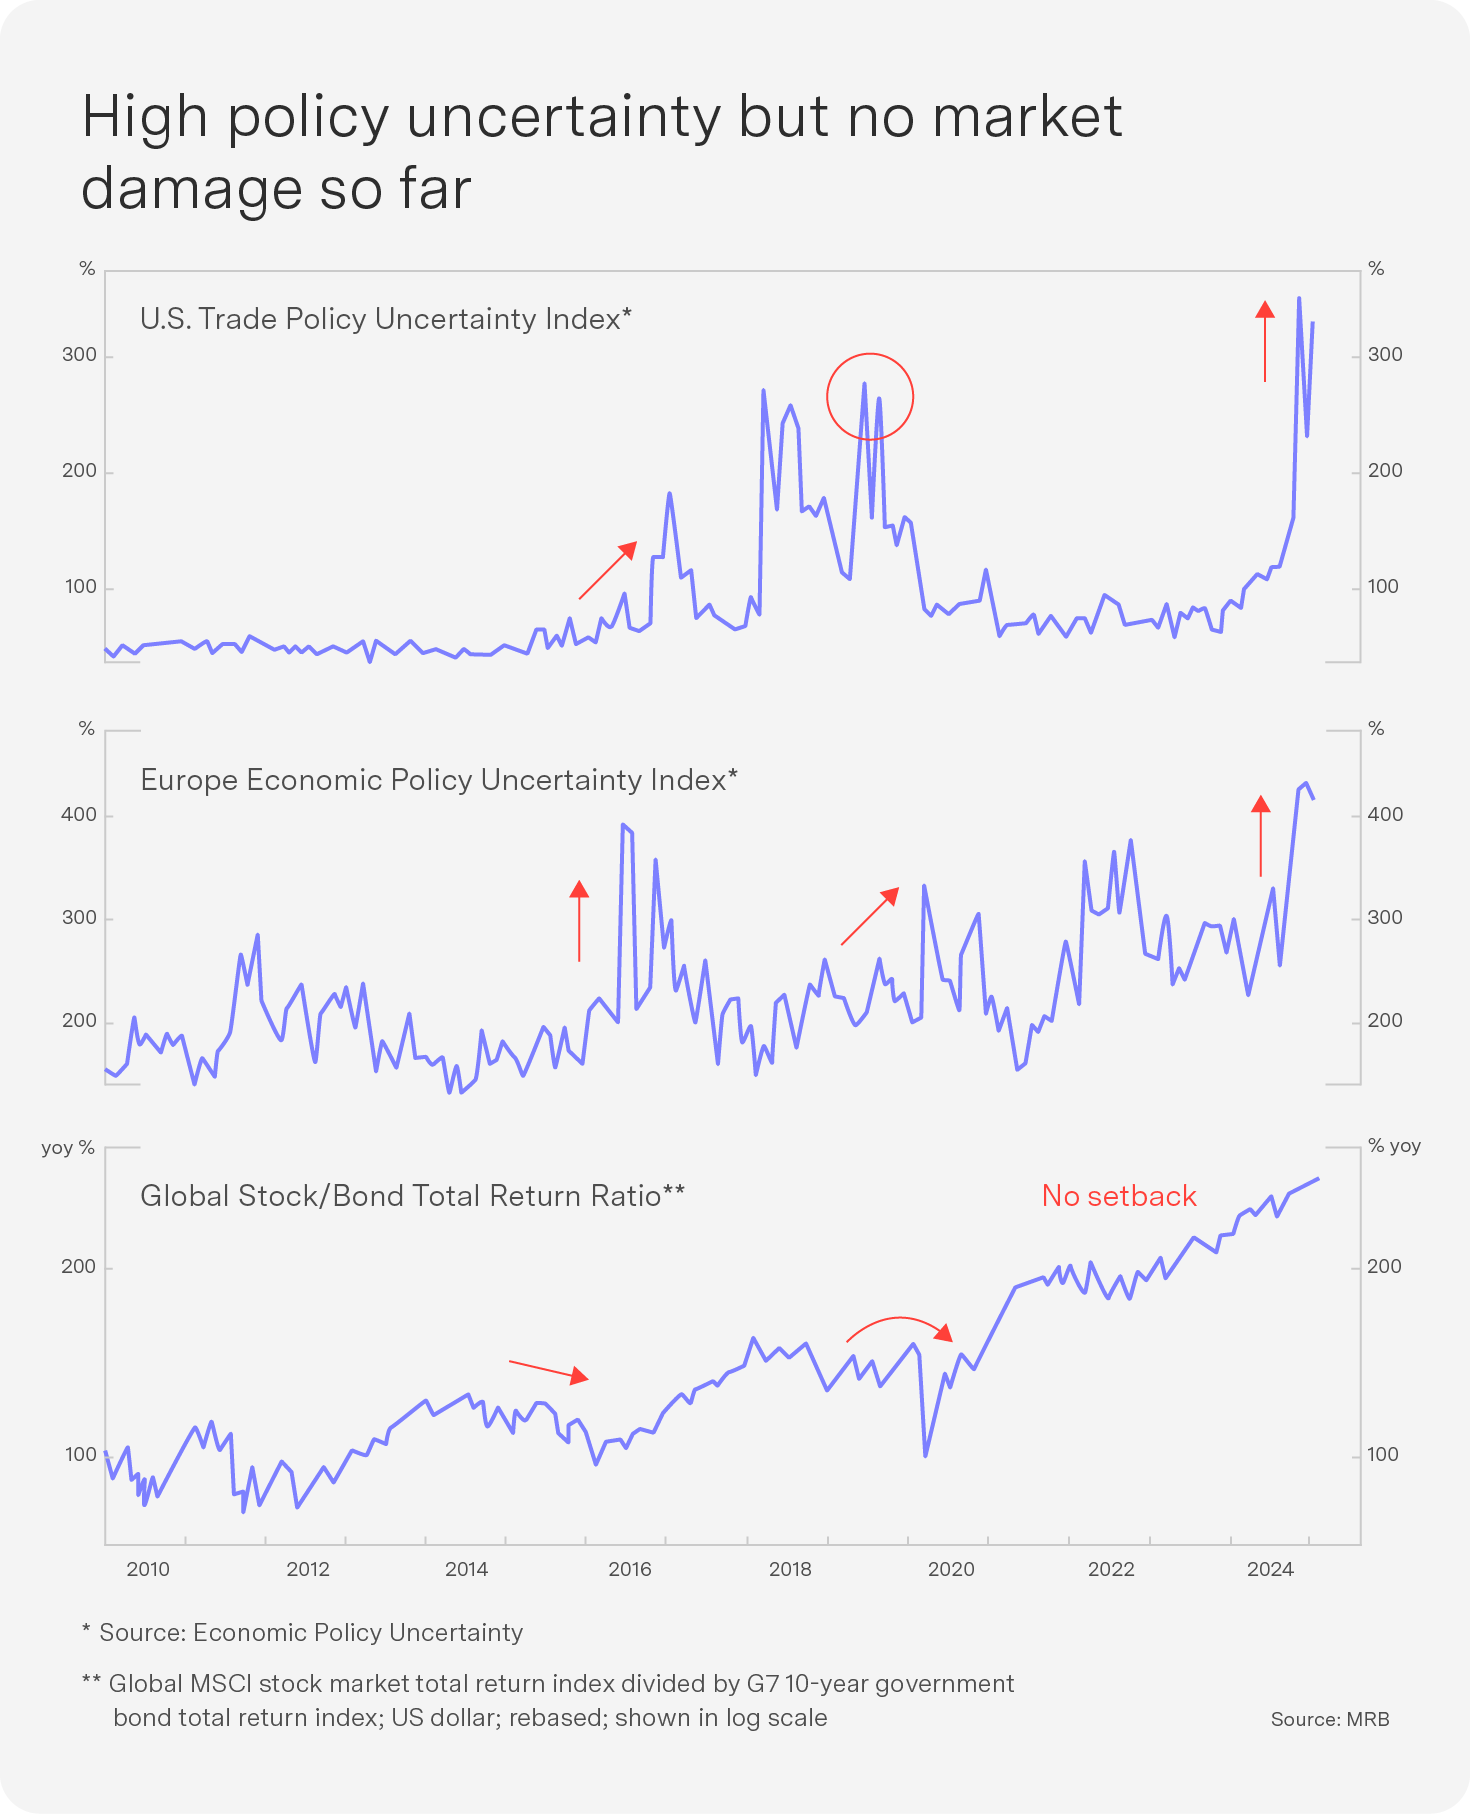
Incoming data remain aligned with our high-for-long interest rate and inflation narrative in which global growth remains resilient, inflation stays sticky and central bank easing remains limited. Upward pressure on interest rates should continue as governments lift fiscal spend for increased defence spending in Europe. Provided Trump does not implement severe tariffs, the choppy risk-on backdrop should persist, with any significant rise in US bond yields resulting in tariff reversals. We remain overweight the US and equities.
European and Chinese markets are bouncing off their lows, but structural headwinds remain, with political uncertainties in Germany and France weighing on confidence and tariff threats remaining to Europe and China – we remain cautious of these bounces.
We remain underweight South African bonds and neutral SA equity given the negative sentiment surrounding the US funding cuts, the resurgence of stage 6 load shedding and the lack of consensus around the Budget. We will review after the updated Budget on 12 March.
Gold has been the best-performing asset class since Trump’s election. Goldman Sachs has a $3 100/ounce year-end target for gold as central banks buy bullion.
Global above-ground gold stock is roughly half in jewellery ($7.0tn), while $2.2tn is in industrial use, central banks hold $2.5tn and private investment sits at $3.4tn. Central banks continue to rebuild their gold reserves – although this trend started after the global financial crisis and not after the freezing of Russian assets – and, after troughing in 2008, reserves are now back to the highs of the 1990s.
Gold will continue running as central banks buy, but there is a risk that the banks will cease purchasing. Meanwhile, platinum remains stuck below the $1 000/ounce level, flat over the last 20 years.
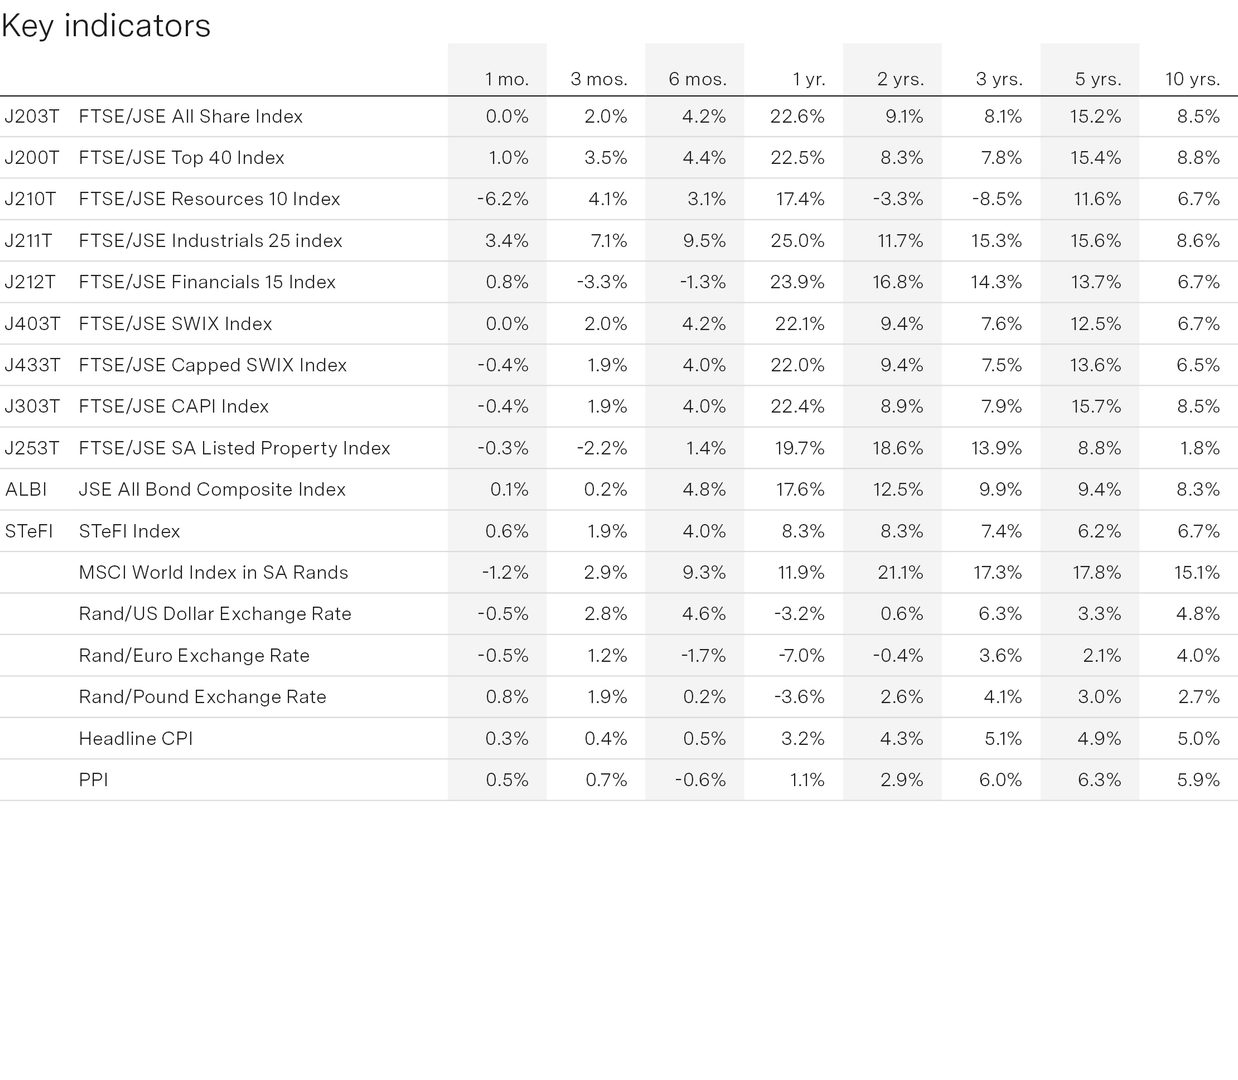
Key indicators