How Anthropic’s Mythos release is changing the playing field
Markets broke to new highs last week, driven by two reinforcing forces: geopolitical de-escalation and strong momentum in artificial intelligence (AI). The key catalysts both occurred on 7 April, when the US announced a ceasefire in the Middle East and Anthropic unveiled its latest model, Mythos, reigniting investor appetite for AI-related themes. The strength within the theme has been striking – 74% of AI-related stocks have subsequently outperformed the broader market. Overall S&P 500 breadth has narrowed to just 26%, however – a dangerously low level. The divergence is telling: this is not a broad-based bull market but a theme-driven rally resting on a narrow and concentrated leadership base.
The fundamental backdrop supports the move. Anthropic’s revenue run rate has tripled year-to-date, and OpenAI’s upcoming Spud release is expected to demonstrate another significant improvement in capability. Concerns about AI-induced job displacement, particularly in software engineering, appear to be easing for now, with hiring resuming across the industry. An Anthropic study found no statistically significant difference in unemployment changes between occupations most exposed to AI and those least exposed since the release of ChatGPT. This is significant, as job losses are the major risk associated with AI.
AI capital expenditure and technology spending more broadly are expected to remain a key driver of S&P 500 earnings this year. The tech sector has shown a stronger trajectory of cash flow than expected, supporting capex – the outlook for which is likely to be revised even higher in light of recent cybersecurity headlines. Mythos can apparently find and exploit previously unknown software bugs on its own, and Anthropic has consequently not made Mythos publicly available as yet. Many companies will have to spend significantly more to secure their systems in a post-Mythos world. Another possible implication is that Mythos’ efficiency may soften demand for data warehouse infrastructure and energy.
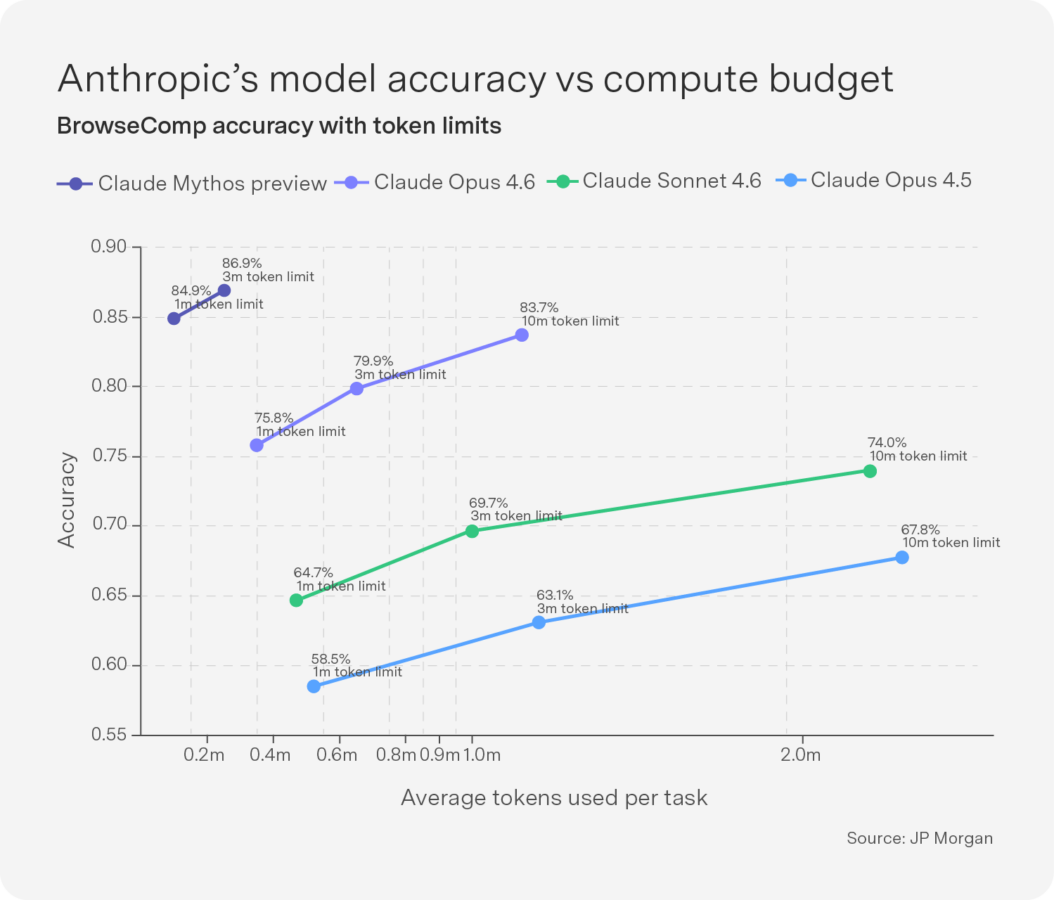
Claude Opus 4.5 was only released 6 months ago and Mythos needs a third of the tokens to generate vastly improved accuracy (see Chart). This and the fact that not every AI model will be a winner means that while there is a scramble for computing capacity now, there may be excess in the future.
Results announced last week highlighted AI’s momentum. Google rallied 4% on news that strong AI demand has boosted its cloud division, while Amazon rallied as its cloud unit posted its fastest growth in three years. Microsoft also reported strong growth in its cloud computing business, with revenue up 39%. However, Meta fell 6% on news it was increasing its capex on AI. Looking further ahead, we expect a broader range of companies to steer toward a meaningful productivity boom as AI adoption reduces marginal costs, expands output and raises real incomes, supporting the broader business cycle.

Delisting from the JSE: What do the data tell us? Part 2
In last month’s Sygnals, I provided an overview of delisting trends from the Johannesburg Stock Exchange (JSE), comparing South Africa to other emerging markets as well as high-income countries. In short, South Africa did not perform well over the 1993–2015 period against the average middle income country. For example, on a market-cap basis, a non-high-income sample recorded a marginally positive and relatively stable net new listings rate (1.2%), while the JSE remained negative at -0.8% over the 1993–2015 period. On average, South Africa underperformed over the period relative to peers in terms of enticing local and global firms to seek capital on its public stock exchange.
In Part II of the delisting debate, I address two issues: First, the impact of this persistently higher delisting rate on concentration levels on the JSE. Second, the broader issue of the factors that explain the JSE delisting phenomenon.
A critical consequence of the sustained delisting pressure over time has been a marked increase in concentration levels on the JSE, measured using the Herfindahl–Hirschman Index (HHI) – a standard tool borrowed from competition policy. The HHI ranges in value from near zero – indicating a highly dispersed market structure – to 10 000, representing maximum concentration in a single firm. Our calculations, derived from firm-level market capitalisation data for all listed companies on the JSE from 2006 to 2024 show that the JSE’s HHI increased by 89% over this period, peaking in 2023. This striking result means that an ever-larger share of total market capitalisation has become concentrated in a smaller number of dominant firms, while smaller and younger companies – facing reduced analyst coverage, lower liquidity and constrained access to equity finance – have steadily lost ground or exited altogether.

To answer the more direct question of what drives delistings from the JSE, we ran a series of time-series and firm-level econometric models (full technical details of hese modes are presented in the
underlying paper). The results are remarkably consistent across all model specifications, with three broad clusters of drivers: firm-level characteristics, macroeconomic conditions and structural and regulatory factors.
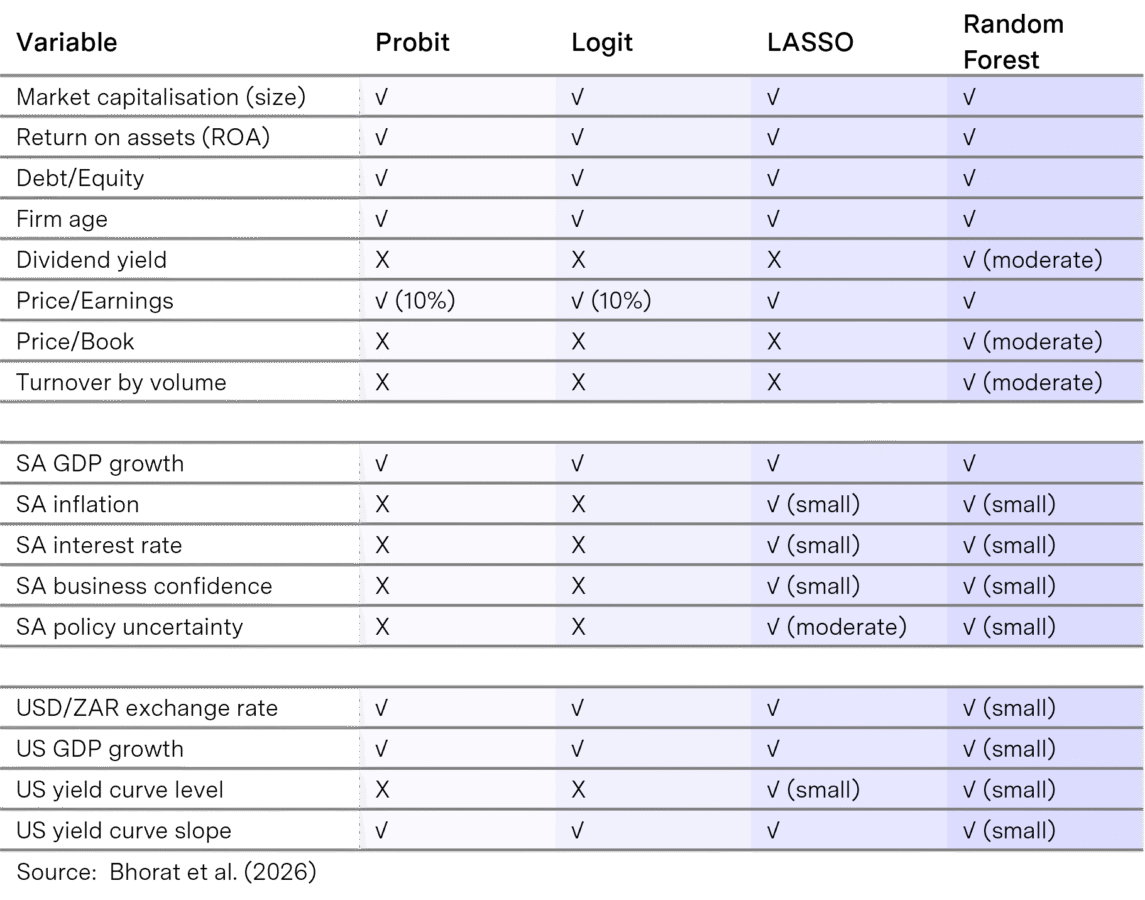
In terms of firm drivers, the results show that larger, older and more profitable firms are substantially less likely to delist. Market liquidity, proxied by turnover by volume, is also a significant predictor in the machine learning model specifications, reinforcing the finding that illiquid firms face structurally higher exit risk. These findings are summarised in Table 1 below.
Macroeconomic conditions such as local and foreign GDP also loom large as determinants of firms’ decisions to delist from the JSE. Specifically, higher domestic growth and exchange rate stability reduce the probability of exit, while global capital market conditions directly affect listing decisions. More specifically, higher local GDP growth – and worsening US growth conditions – reduce the likelihood of delisting. Rand depreciation increases exit risk, reflecting the transmission of broader macroeconomic instability into firm-level listing decisions. At a more granular level, firms in technology, consumer services and basic materials have experienced the sharpest rises in exit intensity over the past decade. Furthermore, strategic delistings tend to cluster during periods of economic recovery, when firms may find private ownership or cross-border mergers and acquisitions (M&A) more attractive relative to the cost and obligations of remaining publicly listed.
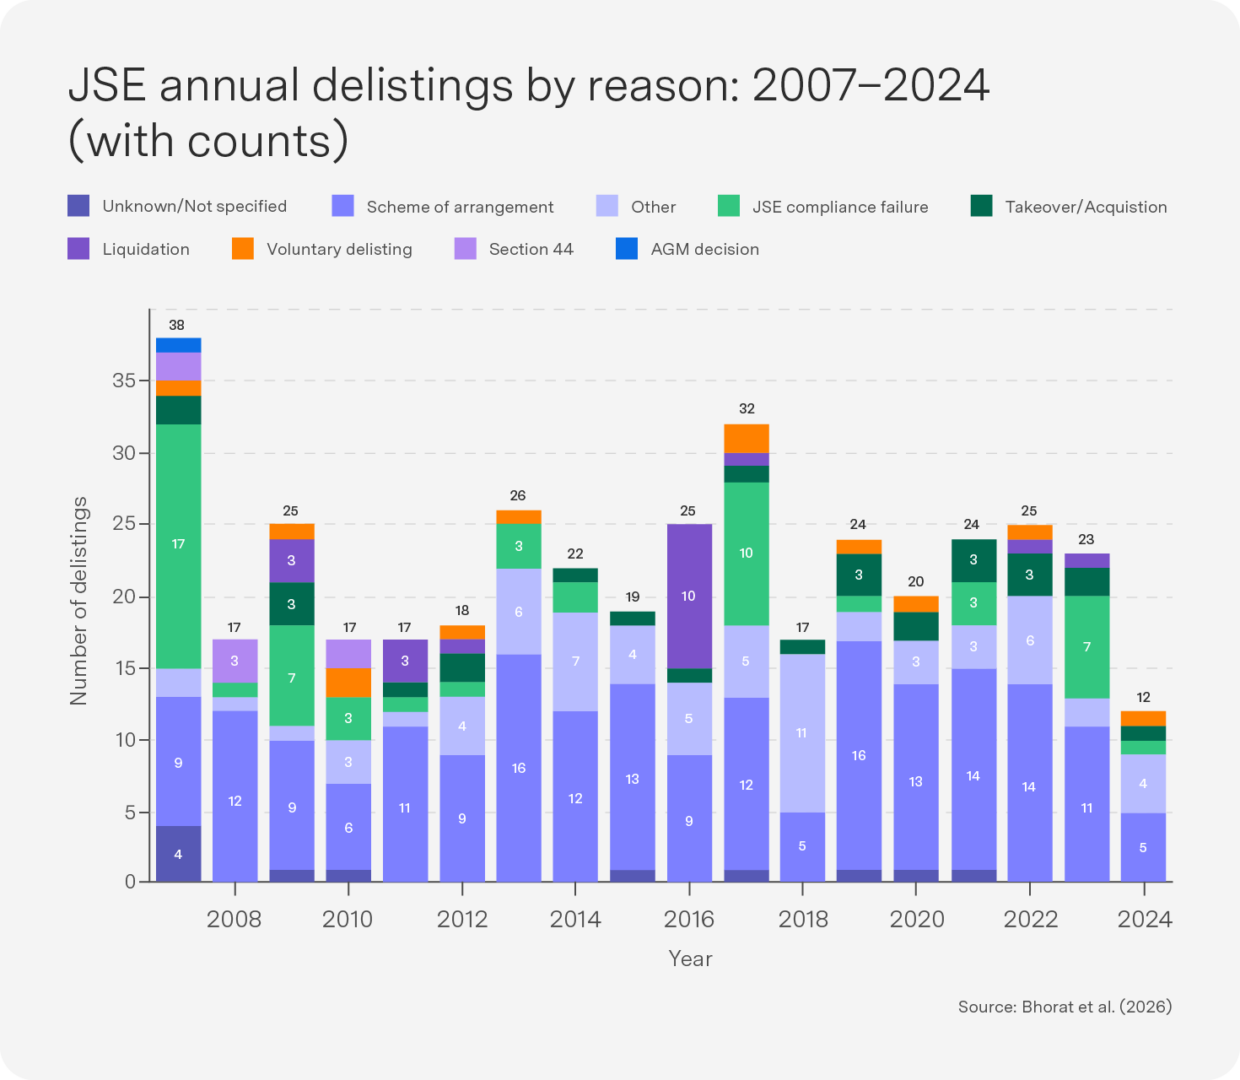
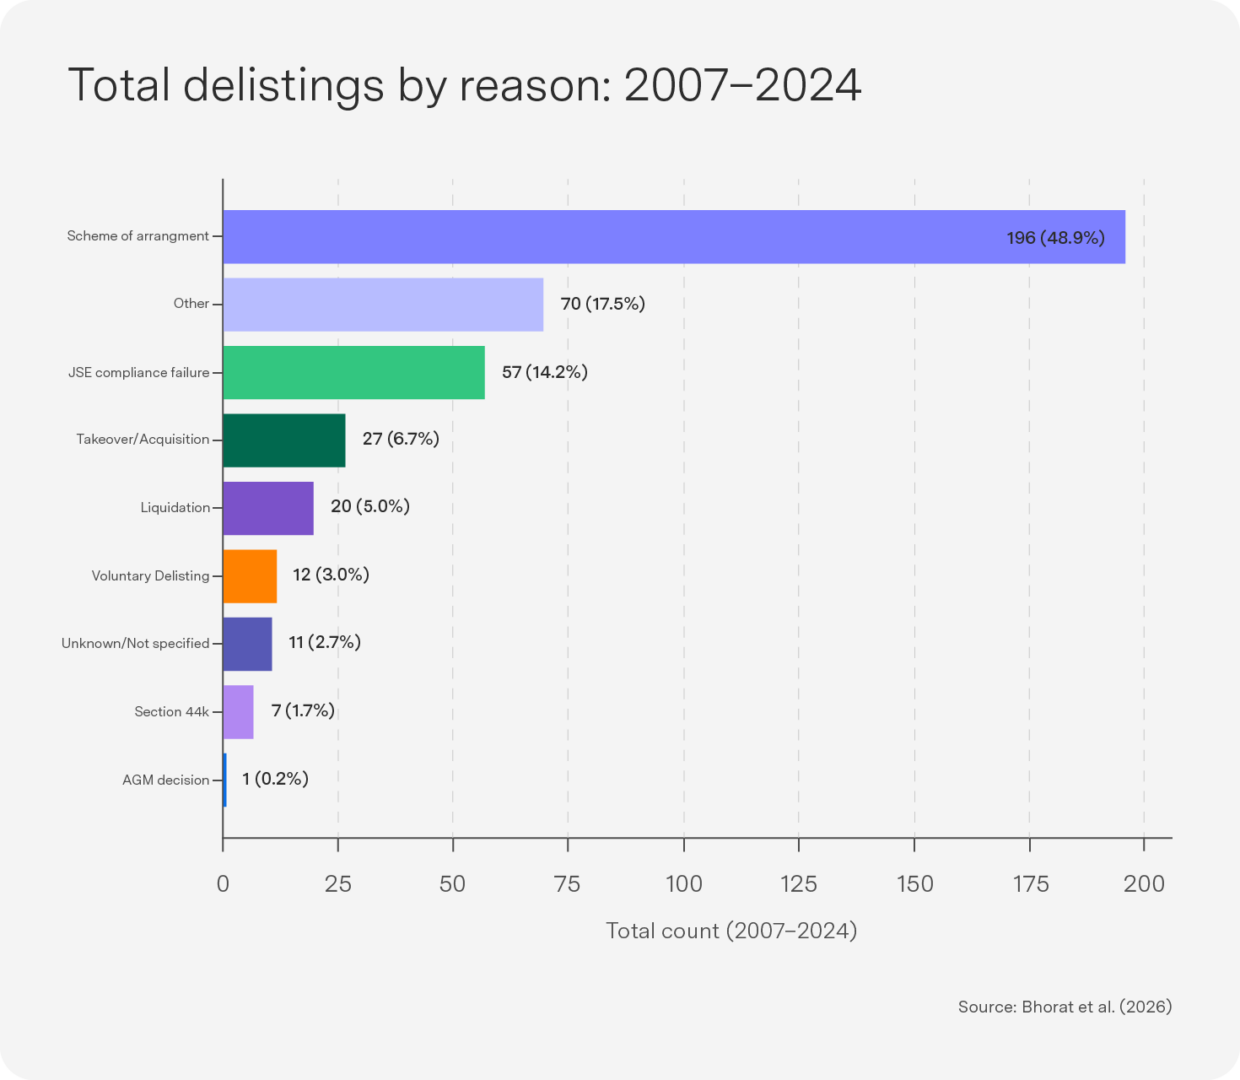
Over the shorter time period of 2007–2024, the majority of exits were driven by restructuring activity, particularly schemes of arrangement (48.9%) – think M&A – with compliance failures also material (14.2%); distress-related exits are relatively limited. This tells us that JSE delistings are, in the main, strategic and transaction-driven rather than the product of firm failure – an important nuance.
Qualitative evidence from senior industry practitioners corroborates the quantitative findings and surfaces deeper structural impediments not readily captured in firm-level data alone. Several recurring themes – including the substantial and ongoing compliance cost burden on smaller listed firms; the erosion of sell-side research coverage; and private equity and cross-border M&A activity attracted by the sustained undervaluation of South African assets – has enabled large-scale corporate restructuring outside the public domain. The latter has reduced the supply of listed growth entities and accelerated the thinning of the exchange. One important disjuncture between the econometric and expert evidence is that the empirical work finds little support for the role of the political economy and business confidence factors (such as BBBEE and state capture) in explaining delisting trends. While the long-term average effect of these factors may be neutral, however, shorter, localised, sector-based impacts can still be a significant determinant. Our study suggests that factors such as BBBEE and state capture over the post-1994 period did not on average effect a firm’s likelihood to delist but did have specific effects in particular sectors over the short term. (The mining industry being a notable example.
Ultimately, our research suggests that the JSE’s delisting challenge is not a single phenomenon with a single cause but is the compounded outcome of firm-level fragility, macroeconomic instability, regulatory cost accumulation and structural shifts in how capital is allocated both domestically and globally. Most troublingly, the JSE appears to be losing precisely the kinds of firms – smaller, younger, innovation-oriented – that in other economies are the engines of job creation, technological upgrading and long-term productivity growth.

Top-performing Sygnia funds
AI and technology drove recovery in April after the Mythos announcement, with FANG leading the pack, followed by the 4th Industrial Revolution Fund. Emerging markets (EMs) were also supported by the tech heavies in Taiwan and South Korea (the KOSPI had its biggest monthly gain since 1998, up 30.6%), which rallied strongly despite China and India lagging in the month.
Over 12 months, the story is mostly the same as last month, with South Africa and EMs topping the charts – though the 4th Industrial Revolution Fund has popped up into fifth place as the markets rotate from EM into tech.
1-month absolute performance as at 29 April 2026
- Sygnia FANG.AI Equity Fund 19.6%
- Sygnia Itrix MSCI Emerging Markets 50 ETF 17.9%
- Sygnia Itrix FANG.AI Actively Managed ETF 14.2%
- Sygnia 4th Industrial Revolution Global Equity Fund 14.0%
- Sygnia Itrix 4th Industrial Revolution Global Equity Actively Managed ETF 10.6%
12-month absolute performance as at 29 April 2026
- Sygnia Itrix MSCI Emerging Markets 50 ETF 54.4%
- Sygnia Itrix Top 40 ETF 29.4%
- Sygnia Top 40 Index Fund 27.9%
- Sygnia Transnational Equities Fund 25.9%
- Sygnia Itrix 4th Industrial Revolution Global Equity Actively Managed ETF 24.3%

US: Resilient growth, sticky inflation, technology support
The US economy remains robust. US retail sales soared in March by the most in a year, suggesting consumers continued to spend on a wide array of merchandise despite a surge in gasoline prices sparked by the Iran war. Fiscal stimulus from the One Big Beautiful Bill Act is also beginning to feed through, with tax refunds running 14% above year-ago levels.
Inflation jumped 0.9% in March, its largest monthly increase in nearly four years, driven primarily by surging gas prices but also by residual tariff pass-through and upward price pressure from net immigration. Gas prices in the US have risen to levels last seen in 2008, when crude oil was at $150/barrel. Grocery bills may also rise as fertiliser supply disruptions work their way through to food prices. Consumer near-term inflation expectations remain elevated, with the University of Michigan one-year measure rising from 3.8% to 4.8%. This is likely to keep the Fed on hold for the rest of the year even if Fed Chair nominee Kevin Warsh feels President Trump’s pressure to cut rates. Warsh won the backing of the Senate Banking Committee to be the next chair of the Fed but still has to be confirmed by the Senate (where the Republicans have a majority). Incumbent chair Jerome Powell’s term ends on 15 May 2026, but he says he has “no choice but to stay” as a Fed governor given the recent legal attacks on the Fed. Republicans will thus not have a majority on the Fed if governor Lisa Cook wins her case against Trump before the Supreme Court, meaning the Fed will still have sufficient checks and balances to remain independent.
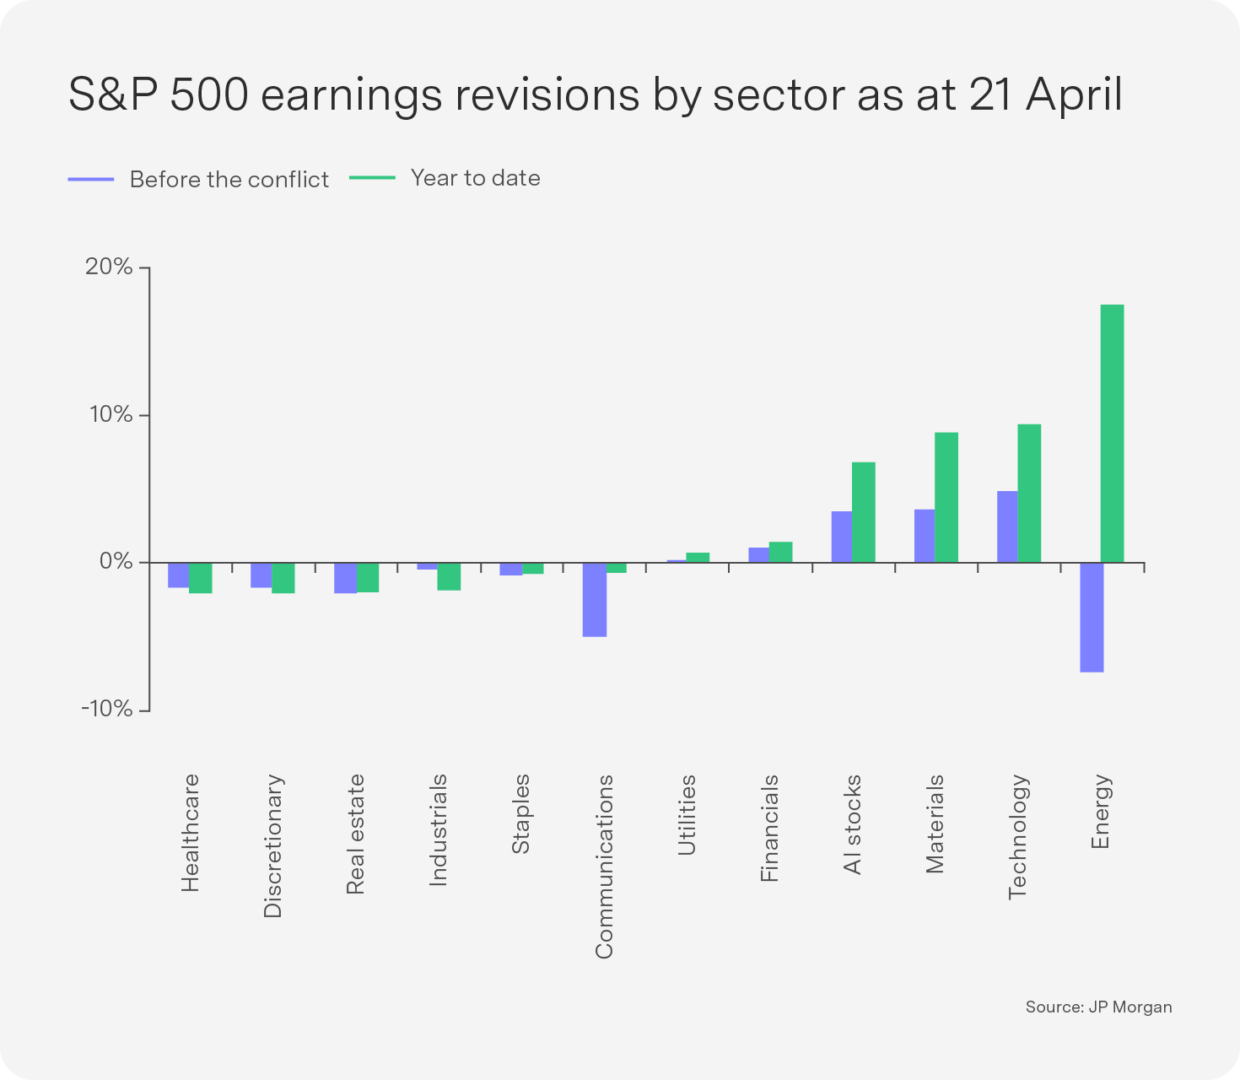
Technology was the key driver of market returns in April, following earnings upgrades to AI and to technology stocks more broadly. Energy stocks rallied in March on the back of earnings upgrades but gave back some of those gains in April as the oil price fell slightly. Elsewhere in the market, the earnings impact from higher oil prices has so far been limited (see Chart), but the picture may become more complicated. Higher oil prices tend to delay interest rate cuts and weigh on consumer spending. While AI and technology provide a meaningful tailwind, slower consumer spending and earnings downgrades in other sectors could create headwinds for the broader market in the months ahead. With midterms coming up, Trump needs a solution to the Middle East conflict.

China: AI exports emerge as a structural growth driver
Chinese President Xi Jinping hosted numerous world leaders in Beijing in April, emphasising Global South unity and criticising the current international order for being in “disarray”. Recent meetings focusing on economic cooperation and strategic partnerships included high-level discussions with officials from the UK, Taiwan, Canada, Germany, Mozambique, Russia and Spain.
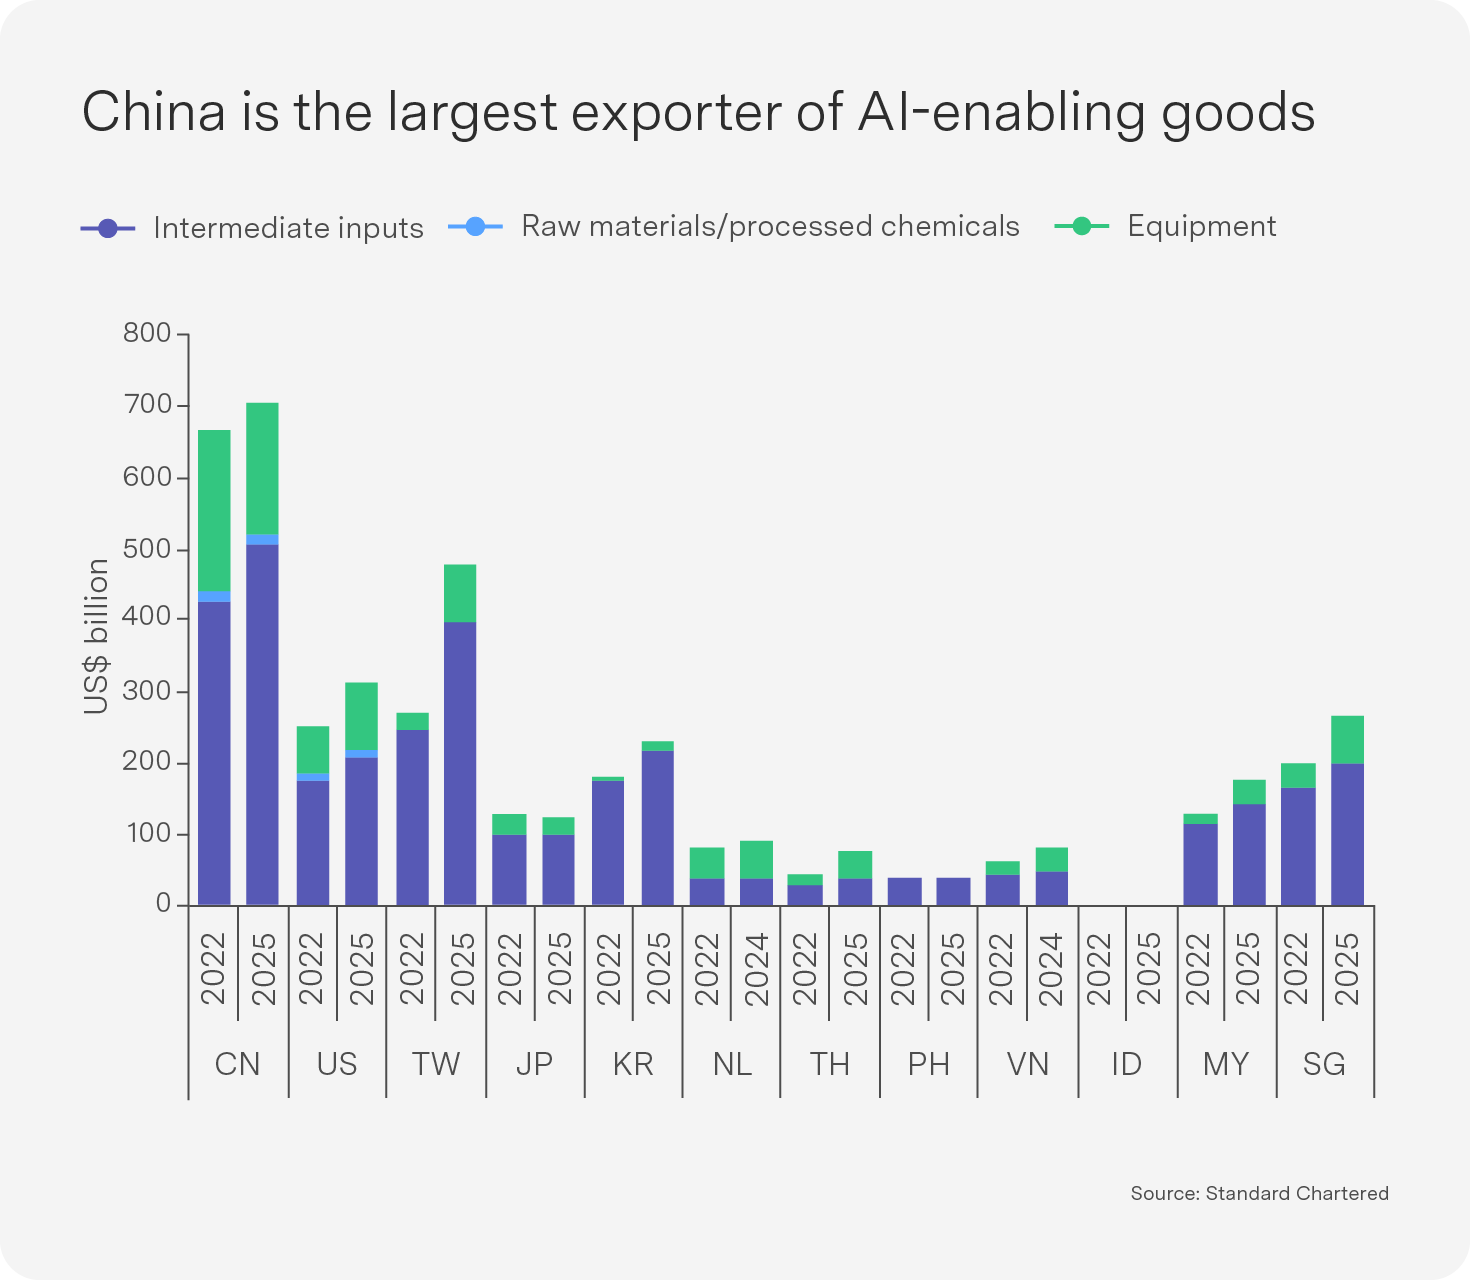
EM stocks rebounded strongly but China lagged the market, driven by tech exposure in Taiwan and South Korea. However, the World Trade Organization ranks China as the world’s largest exporter of AI-enabling goods, and exports continue to support China’s growth. Its export mix spans the full value chain, from raw materials and integrated circuits to hardware, software development and AI deployment. Low energy costs, scalable computing infrastructure and strong manufacturing capabilities underpin China’s competitive position. In late April, China’s DeepSeek released V4 Pro, which reviewers place on par with Claude Opus 4.6 and GPT 5.4 – but at three to ten times less the cost.
The key question is how quickly China can move into higher-value segments of the supply chain, which will depend on continued domestic technology development. We remain neutral EMs, as higher oil prices (and food prices) impact EMs more than developed markets, and we prefer our AI exposure from US markets.

Outlook: Supply-disruption risks remain, with emerging markets bearing the brunt
Oil reached new highs, touching $126 per barrel, its highest level since 2022, amid reports that the US is considering military action against Iran to break a deadlock in peace talks. Despite Trump extending the 7 April two-week US–Iran ceasefire indefinitely, the US military has maintained its blockade of the Strait of Hormuz, which Iran regards as a contravention of the ceasefire terms.
Iran has presented a revised peace proposal in which nuclear negotiations are deferred to a later stage, but Trump insists that any deal must address Iran’s nuclear programme.
The standoff carries broader strategic implications, as choking a critical Chinese energy-supply route also risks a direct confrontation with President Xi. Lebanon and Israel are preparing for their first direct talks in decades – a cautiously historic step. The process faced immediate headwinds, however, when Hezbollah formally rejected the talks, and Israeli strikes on targets in Lebanon have also undermined hopes of a peace deal.
Oil continues to flow, through longer, rerouted passages at materially higher insurance premiums – and it will take weeks for ships to arrive at their destinations even after the strait is open again. The International Energy Agency (IEA) has warned that prices do not yet fully reflect the true severity of the supply disruption. Thirteen million barrels per day have been taken offline, with more than 80 energy facilities damaged – more than 10% of global capacity. IEA Executive Director Fatih Birol cautioned that a full recovery could take up to two years.
The International Monetary Fund’s April 2026 World Economic Outlook revised global growth down from 3.3% to 3.1% for 2026, with 2027 holding steady at 3.2%. EMs bore the brunt of the downgrade – cut by 0.3 percentage points for 2026 – while developed markets were largely unchanged. The global forecast on inflation rose from 3.8% to 4.4% for 2026, easing only modestly to 3.7% in 2027 (and still well above January’s projection of 3.4%).
The economic scars of the conflicts are likely to outlast the fighting itself. A notable regional divergence is expected depending on how the commodity price surge affects countries’ terms of trade.
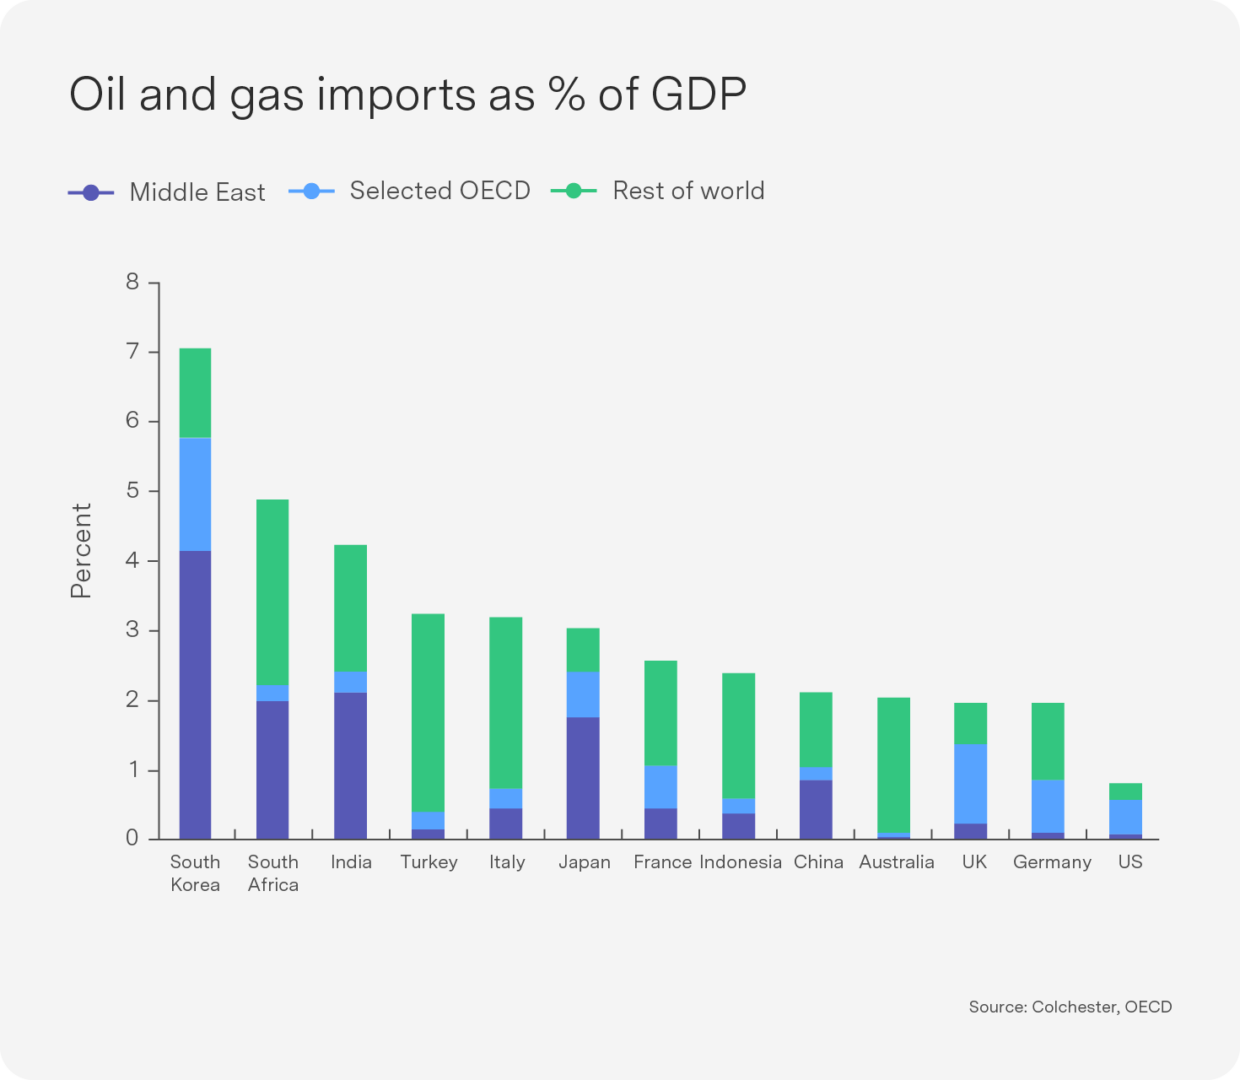
Energy exporters – the US, Canada, Norway – stand to fare relatively better; energy importers – Japan, Europe and most EMs – face a more difficult adjustment. Emerging markets face the greatest headwinds as the largest importers of oil and gas as percentage of GDP while the US remains the most insulated (see Chart). We increased global equities on the ceasefire announcement, as a recession remains unlikely; this has worked well thanks to the AI rally, but we remain cautious on the outlook.
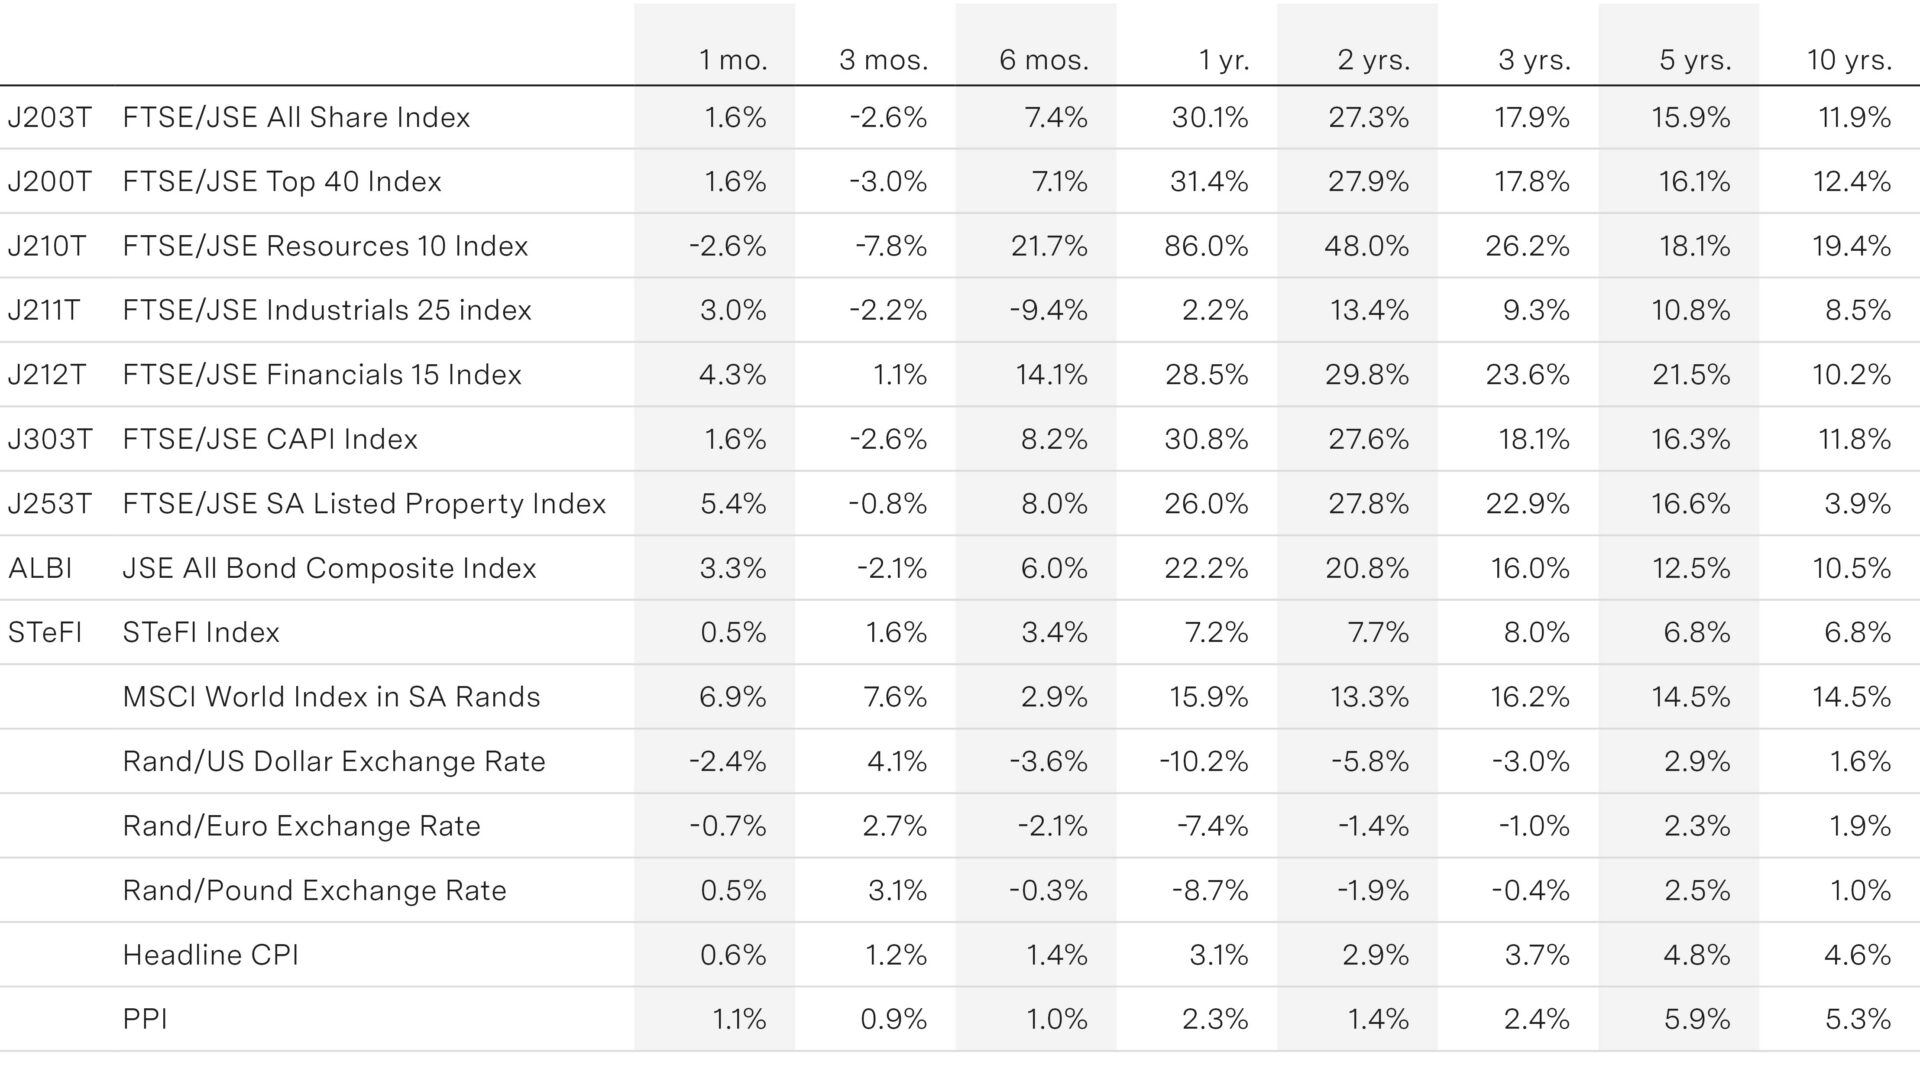
Key indicators