China’s AI leap forces a reckoning over America’s trillion-dollar AI capex bet

A new AI model from Chinese company Moonshot sent a jolt through global tech markets in July, dragging down shares of chipmakers, memory producers and data-centre builders. It has deepened a concern that has been building for a while: Will the hyperscalers (tech giants like Meta, Google, Microsoft, Amazon and Oracle) pouring hundreds of billions of dollars into AI actually see a return on that spending?
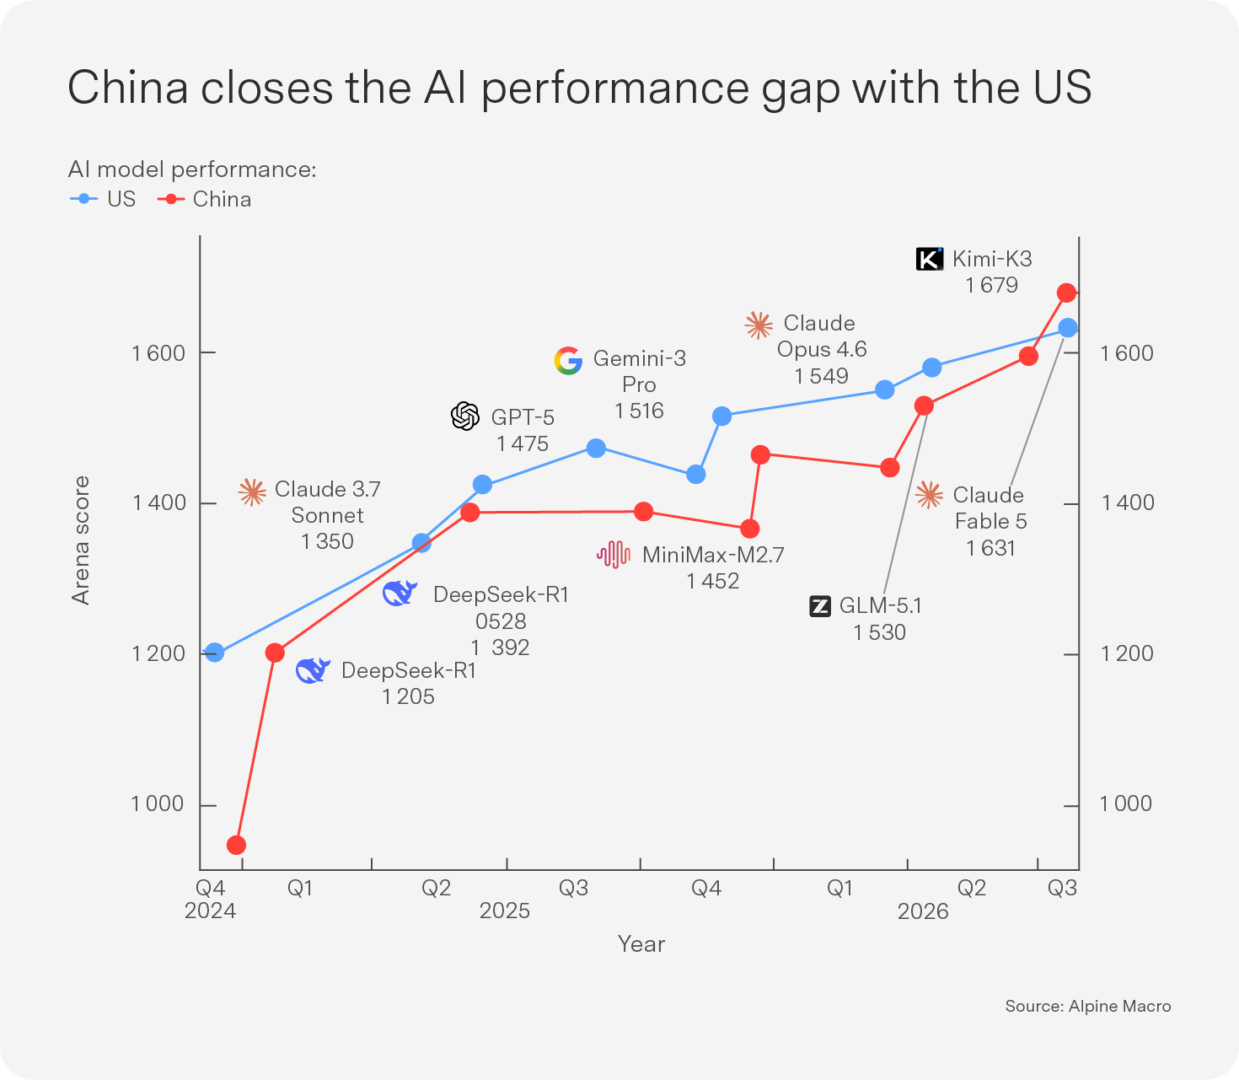
Moonshot’s new model, Kimi K3, ranked ahead of Anthropic’s Opus 4.8 according to independent testing group Artificial Analysis, making it the first Chinese open-weight model to surpass a leading US model at this level (see chart). China is already known for producing cheaper AI models; Kimi K3 suggests it can now compete on quality too. Alibaba shares rose on similar news after the company previewed its flagship Qwen3.8 Max model, which it described as second only to Anthropic’s Claude Fable 5, though Kimi K3 reportedly delivers comparable performance at roughly one-third of Fable 5’s cost per task. These launches have intensified investor concern that cheap, cutting-edge Chinese AI could push US companies to rely more on these models instead of building their own processing capacity, reducing demand for chips and data centres. Apple, for instance, has already said it will use Alibaba’s Qwen AI and Baidu’s search engine to serve the Chinese market. The selloff in semiconductor stocks deepened as signs of China’s progress in advanced memory and chipmaking weighed on global rivals (see China section for more details).
AI-related capital expenditure is at record highs and has been one of the biggest drivers of stock market gains this year. Bloomberg forecasts AI capex will reach $963 billion in 2027, an acceleration pushing hyperscalers’ prospective free cash flow into negative territory. Google’s share price fell 7% on its latest quarterly results despite 82% growth in AI-driven cloud revenue, marking the company’s first quarter of negative free cash flow since going public. From here, the way forward could take several routes:
Commoditisation. Chinese models could erode the pricing power of US AI models. Prices for AI tokens have been falling, and the Silicon Data LLM Token Expenditure Index has dropped nearly 30% from its May peak, coinciding with the recent underperformance in AI hyperscaler stocks.
Efficiency gains. Meta’s stock rose after an internal memo suggested the company can build AI computing capacity more cheaply than expected, a dynamic that could trigger a rotation out of semiconductor names and back into hyperscaler stocks.
Demand expansion. The more optimistic view is that cheaper models will simply expand the addressable market and that the drop in token prices reflects additional usage rather than a price war. Token consumption rose from 11.4 billion tokens per week in 2024 to 15.6 trillion tokens per week in July 2026, an increase of roughly 1 370 times.
The path forward will probably be a combination of the three. US security concerns are likely to limit the scope for Chinese model adoption domestically, while underlying compute demand shows little sign of weakening. For now, the global economy is experiencing a period of exceptional growth driven by the AI capex boom, and the upcoming round of hyperscaler earnings and capex forecasts will be closely watched for signs of which path is dominating the outlook.
The municipal financial mess

In its national budgeting process, National Treasury partly funds municipal operations across the country through an unconditional transfer, but it has apparently had enough of ongoing financial negligence and mismanagement. Directed by the Minister of Finance, National Treasury invoked section 216(2) of the Constitution and section 38 of the Municipal Finance Management Act (MFMA) on 8 July 2026 to temporarily withhold the equitable share transfer due to 71 financially delinquent municipalities until they have resolved their financial misdemeanours. This is a consequence of a crisis in local government finances that has been building in plain sight for well over a decade.
Municipal transfers are based on an “equitable share” formula that considers local communities’ service needs (such as water, electricity, sanitation), corrected for by need, revenue-raising capacity and population to address uneven spatial economic development in the economy. It is ideally a fiscal redistribution tool anchored in the basic needs of some 11.2 million poor households, channelling roughly R200 billion in 2026/27 to the country’s 257 municipalities – representing just under 8% of total government expenditure; this is a significant fiscal allocation. The crisis is a result of the pervasive mismanagement of these and other independently earned revenues. As the graph below shows, these 71 delinquent municipalities are spread across every province in the country and constitute close to a third of the country’s population – roughly one in three South Africans. Gauteng, unsurprisingly, dominates: its affected municipalities, led by the City of Johannesburg, account for 10.6% of the national population on their own, followed by North West (4.5%) and the Eastern Cape (4.2%). Given the concentration of manufacturing, retail and logistics activity in and around these municipalities, the businesses and workers exposed to service disruption run well beyond the residential population figures alone. This is not a marginal financial collapse affecting a minority of individuals in small towns scattered around the country: It is a core and critical financial collapse in local government that is deleteriously affecting core parts of the South African economy. That the City of Johannesburg sits front and centre of this financial mismanagement is emblematic of the nature and scale of the collapse.
Three distinct failures recur according to Attorney-General reports: First, outright theft and irregular procurement, evident in often public examples of corruption and malfeasance. Second, a hollowing out of technical and financial skills has removed critical skills – from the most basic skills required to run a municipality to water sanitation engineering capabilities and asset maintenance management. Third, basic financial governance of credit control, debt management and expenditure authorisation has collapsed. The latter is perhaps most visible in municipalities able to generate revenue, but a breakdown in collections systems, billing and so on has essentially generated a financial crisis. The Auditor-General’s numbers tell the story in numbers: municipalities have racked up R145.21 billion in irregular expenditure since 2021/22, R118.13 billion in unauthorised expenditure and R24.12 billion in fruitless and wasteful expenditure, while some 116 municipalities (45%) adopted unfunded budgets in 2024/25.
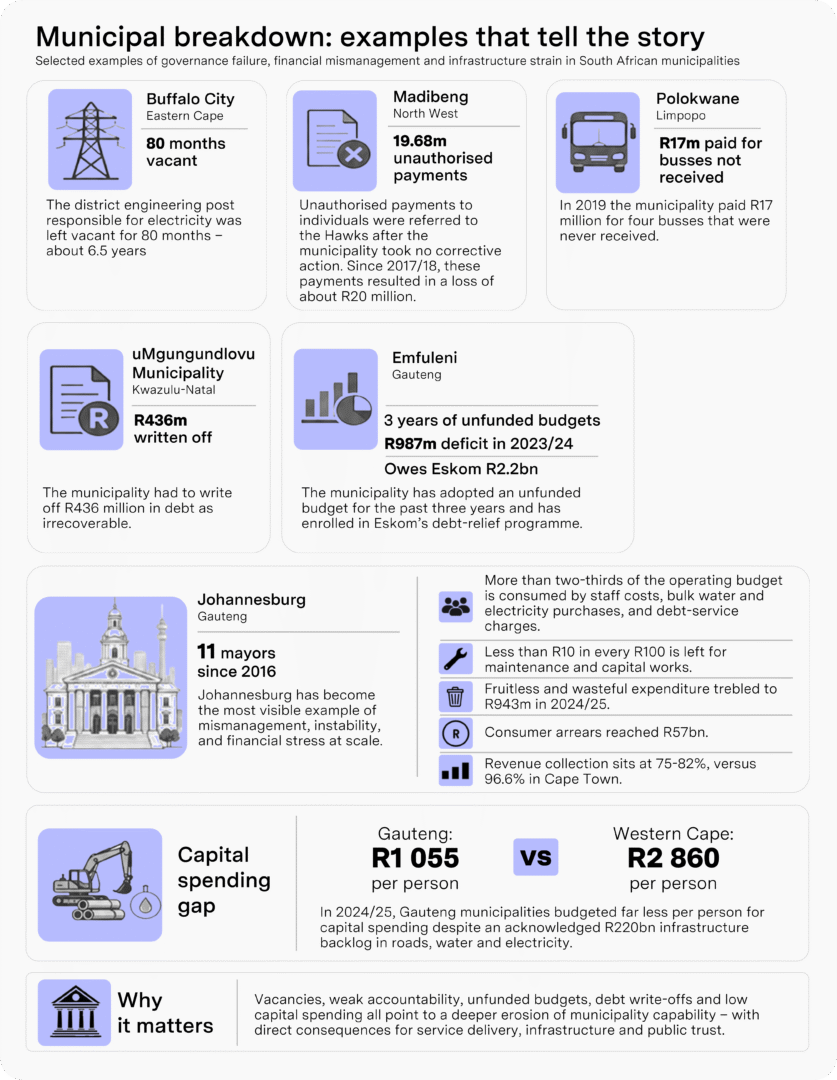
Here are just a few specific examples: Buffalo City left its district engineering post responsible for electricity vacant for 80 months – 6.5 years! Madibeng’s R19.68m in unauthorised payments to private individuals was referred to the Hawks after the municipality took no corrective action. Since 2017–18, Madibeng Local Municipality (North West) has made unauthorised payments to private individuals resulting in a loss of 20m. In 2019, Polokwane (Limpopo) paid R17 million for four buses it has not received. The uMgungundlovu Municipality (KwaZulu-Natal) has written off R436m in debts as irrecoverable. Emfuleni (Gauteng) has adopted an unfunded budget for the past three years and ran an eye-watering deficit of R987 million in 2023–24! It owes Eskom R2.2b and has enrolled in the Eskom debt-relief programme. Johannesburg is probably the most public example of total mismanagement, theft and corruption at scale: The city has cycled through 11 mayors in 10 years. Staff costs, bulk water & electricity purchases – and, crucially, debt-service charges – now consume more than two-thirds of the operating budget, leaving under R10 in every R100 for maintenance and capital works. Its fruitless and wasteful expenditure (the technical term for corruption) trebled to R943 million in 2024/25, while consumer arrears reached R57 billion and revenue collection was at 75–82% (against 96.6% in Cape Town). Gauteng’s municipalities budgeted just R1 055 per person on capital spending in 2024/25 versus R2 860 in the Western Cape – despite an acknowledged R220 billion infrastructure backlog in roads, water and electricity.
Unpaid energy bills are probably the starkest expression of this crisis. Overdue municipal debt to Eskom has grown roughly 40-fold since 2014, and only 15 of the 71 municipalities enrolled in Eskom’s Municipal Debt Relief Programme have consistently met its conditions. Government has responded with distribution agency agreements, under which Eskom takes over electricity distribution and billing on behalf of chronic defaulters. Municipalities that refuse become liable for their full debt.
A parallel Smart Meters Grant has installed 139 000 meters in the 71 debt-stressed municipalities to curb illegal connections and billing failures.
The economic cost is now well beyond the municipal balance sheet. It is clear that collapsing local infrastructure will constrain national growth and is not just a nuisance factor to local and foreign investors. The services collapse in local government is a wider version of load shedding: It serves as both a deterrent to much-needed investment and implicitly places a ceiling on how fast the economy can expand. Johannesburg alone, home to the JSE and roughly 16% of national GDP, has an estimated R170 billion maintenance backlog on its electricity grid; Gauteng’s broader infrastructure backlog now tops R220 billion. This collapse of the economic heartland reads like a repeat of the electricity crisis of just a few years ago.
National Treasury is doing its best to correct this ongoing crisis through a corrective measure to force better financial performance from municipalities. Time will tell if we see an improvement, which is to be measured by a 25% reduction in unauthorised, irregular, fruitless and wasteful expenditure (UIFWE), but the political winds of change are most likely to enforce corrective action. As the graphic below shows, voters across provinces have been voting with their feet to exact basic municipal management.
Top-performing Sygnia funds

The Sygnia Life Bitcoin Plus Fund roared into first place over one month as gold and bitcoin recovered. China was in second place after a number of AI-positive announcements on both the model and manufacturing fronts. The FTSE moved into third place due to its high allocation to oil and gas companies. The more defensive healthcare and property funds took up the last two spots as tech weighed on the major indices.
Emerging markets remain solidly in first place over twelve months, with South African funds taking up the remaining four positions across all major asset classes – equities, bonds and cash.
1-month absolute performance as at 30 July
- Sygnia Life Bitcoin Plus Fund: 11.1%
- Sygnia Itrix MSCI China Feeder ETF: 9.2%
- Sygnia Itrix FTSE100 ETF: 4.6%
- Sygnia Itrix Global Property ETF: 3.3%
- Sygnia Health Innovation Global Equity Fund: 3.3%
12-month absolute performance as at 30 July
- Sygnia Itrix MSCI Emerging Markets 50 ETF: 29.0%
- Sygnia Listed Property Index Fund: 24.6%
- Sygnia Transnational Equities Fund: 23.3%
- Sygnia Enhanced All Bond Fund: 17.9%
- Sygnia All Bond Index Fund: 17.3%
US: Exceptionalism 2.0 – growth, returns on equity and a hawkish Fed converge

Fed Chairman Kevin Warsh reiterated that the central bank has “no tolerance” for persistently high inflation. In his semi-annual testimony to the House Financial Services Committee, Warsh said he was confident that if policy is calibrated correctly, “the inflation surge of the past five years will be a thing of the past”. He acknowledged that the labour market remains healthy, and he stressed that inflation is still running above the Fed’s 2% target. Warsh also announced the leadership of the Fed’s new policy task forces. The group leans hawkish overall, drawing heavily on figures known for warning about the costs of loose money, financial instability and the importance of credible inflation-fighting.
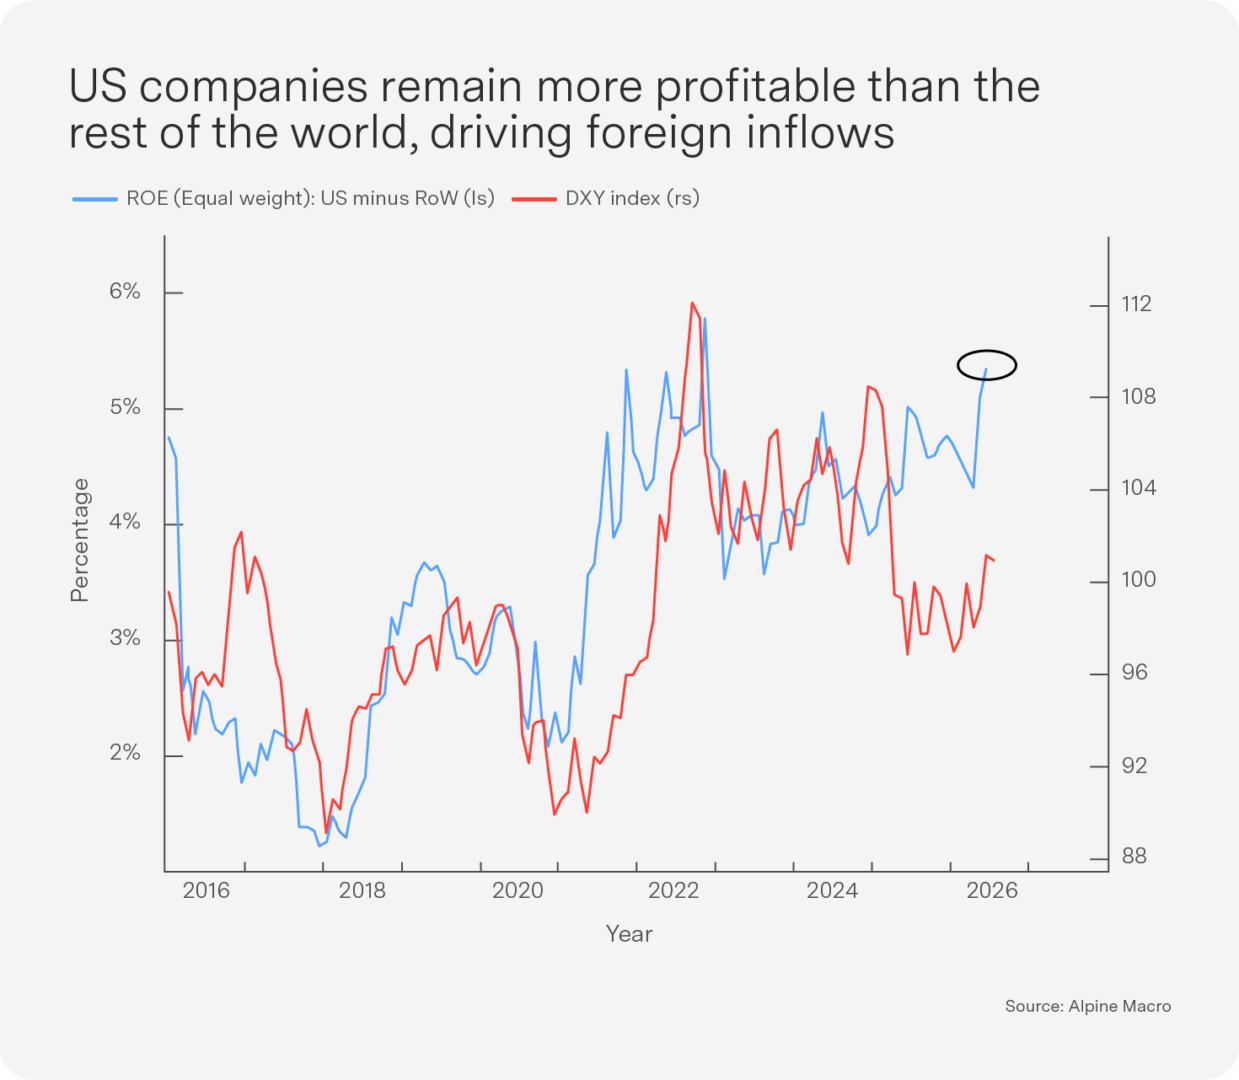
Dollar strength this year reflects more than just a resilient labour market and a hawkish Fed. US growth, which lagged the rest of the world through 2025, is now leading, historically a supportive factor for the dollar. US corporate returns on equity also remain well above the rest of the world’s, drawing in foreign investment and further supporting the currency. High US interest rates, maintained as the Fed works to bring down inflation, continue to attract bond investors to US assets. And finally, US trade-policy uncertainty has fallen sharply from its “Liberation Day” peak, removing another headwind. We remain overweight global equities.
China’s AI momentum builds, even as broader growth slows

Kimi K3’s debut also challenges the assumption that US curbs on advanced chip exports will slow China’s AI progress, and the launch lifted Chinese memory and semiconductor stocks. K3 requires far more memory capacity than earlier model generations, indicating sustained demand in a market still dominated by only a few suppliers, such as South Korea’s SK Hynix and Samsung. Chinese memory chipmaker ChangXin Memory Technologies surged 466% on listing, becoming China’s biggest onshore-listed company, a sign of how strongly investors are backing the domestic chip supply chain behind China’s AI push.
China’s edge is increasingly extending upstream into the equipment used to make chips. Shares for Netherlands-based ASML fell 9% after reports that China has started mass-producing homegrown deep ultraviolet (DUV) chipmaking tools. The news reinforces a growing concern for the sector: China’s advantage is no longer limited to developing competitive AI models at lower cost as manufacturing capacity increasingly becomes part of the equation.
China’s edge extends beyond hardware to talent and influence. The country went from having the world’s second-largest pool of top AI researchers in 2022 to the largest in 2025, strengthening Xi Jinping’s hand in shaping global AI rules. Xi made his first appearance at China’s premier AI summit, underscoring Beijing’s push to lead the field, and 29 countries, including Russia, have joined the China-led World AI Cooperation Organization, a new intergovernmental body headquartered in Shanghai.
This tech-driven strength stands in contrast to its broader economy, which slowed in the second quarter as domestic demand weakened further. Strong export performance, driven by the global AI boom, helped offset soft domestic demand, but not enough to keep growth above the government’s target.
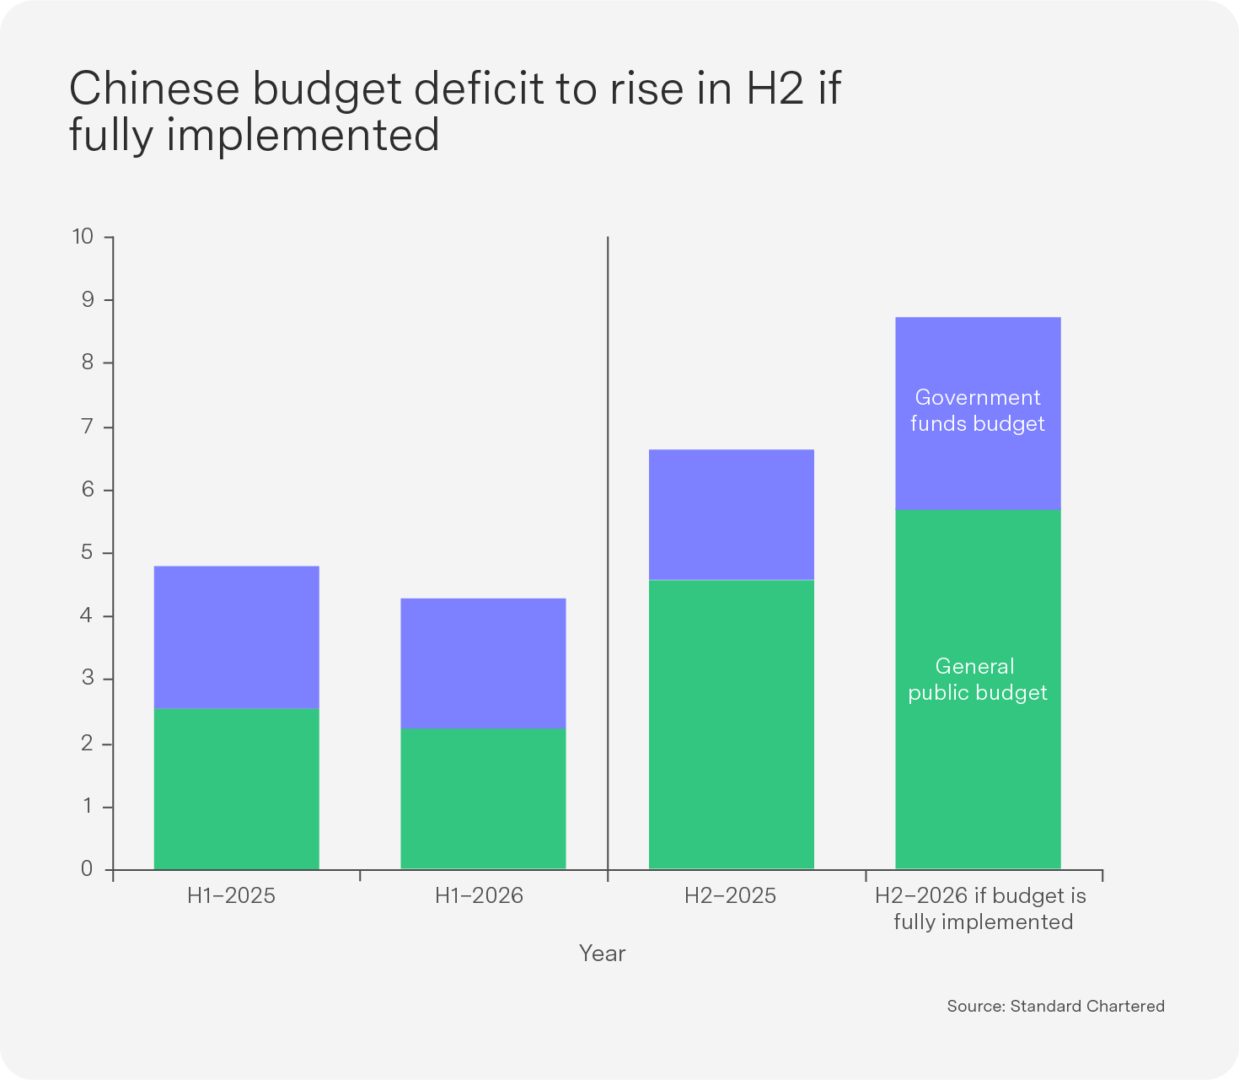
Both business investment and consumer spending softened during the quarter, while the housing market correction deepened. Fortunately, the government has sufficient policy headroom to support the economy; the key constraint is the execution of existing plans rather than the addition of new ones (see chart). As a result, the July Politburo meeting is likely to focus on improving execution rather than expanding policy, though the tech sector, buoyed by the AI boom, is likely to remain a priority within that existing framework.
Oil: Why falling oil prices did not bring down fuel costs

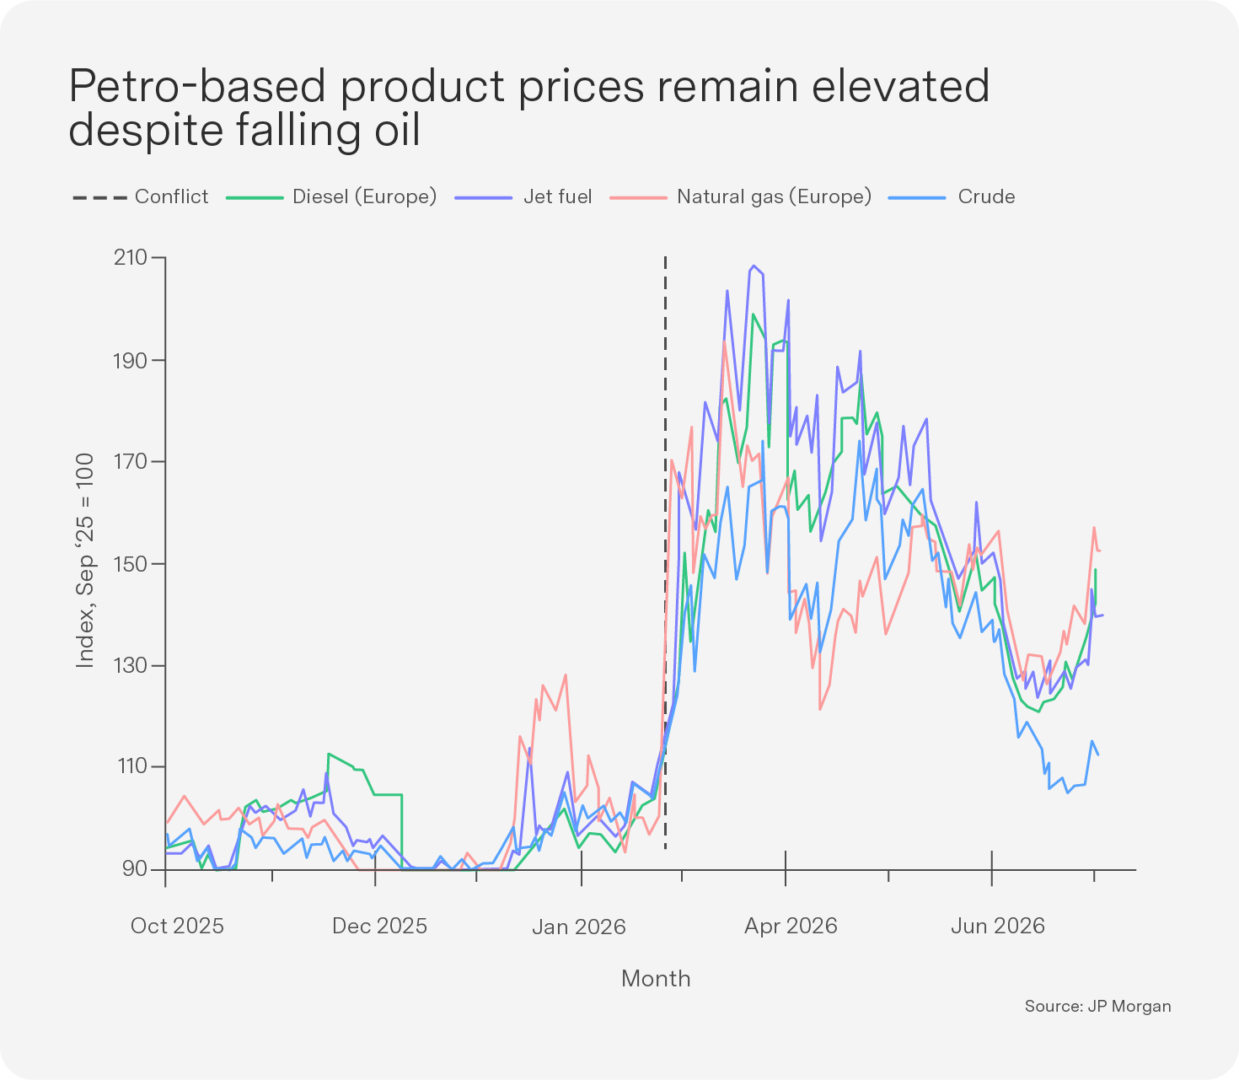
The de-escalation implied by the Iran-US memorandum of understanding proved short-lived, and even where crude prices pulled back, refined products (natural gas, diesel and jet fuel) remain elevated (see chart) as roughly 8 million barrels per day (mbd) of refining capacity, around 10% of the global total, is currently offline, concentrated across the Middle East, China and Russia.
- The Middle East. Over 30 attacks have hit separate refineries and oil-processing facilities across the region, but the extent of the physical damage remains largely unknown. JP Morgan’s base case assumes 3–4 mbd are currently offline.
- China. Chinese refinery runs are down an astonishing 3.0 mbd. Beijing wants to be confident that flows have fully stabilised and are no longer subject to regular interruptions before it eases refined-product export quotas and allows state refiners to lift utilisation.
- Russia. Russia is the world’s second-largest diesel exporter, supplying about 12% of global diesel exports (0.8 mbd), and the largest exporter of fuel oil, with roughly a 16% share (0.9 mbd). Ukraine’s General Staff estimate that 42.7% of Russia’s total designed refining capacity was disabled as of early July 2026, following a month of systematic strikes that included eight successful attacks on refineries. Russian refinery runs are 1.5 mbd less than at the start of the year. The export impact was visible in trade data even before the diesel ban took effect: Russian seaborne diesel shipments collapsed in June to their lowest level since at least 2017.
South Africa – equities look cheap as SARB supports growth

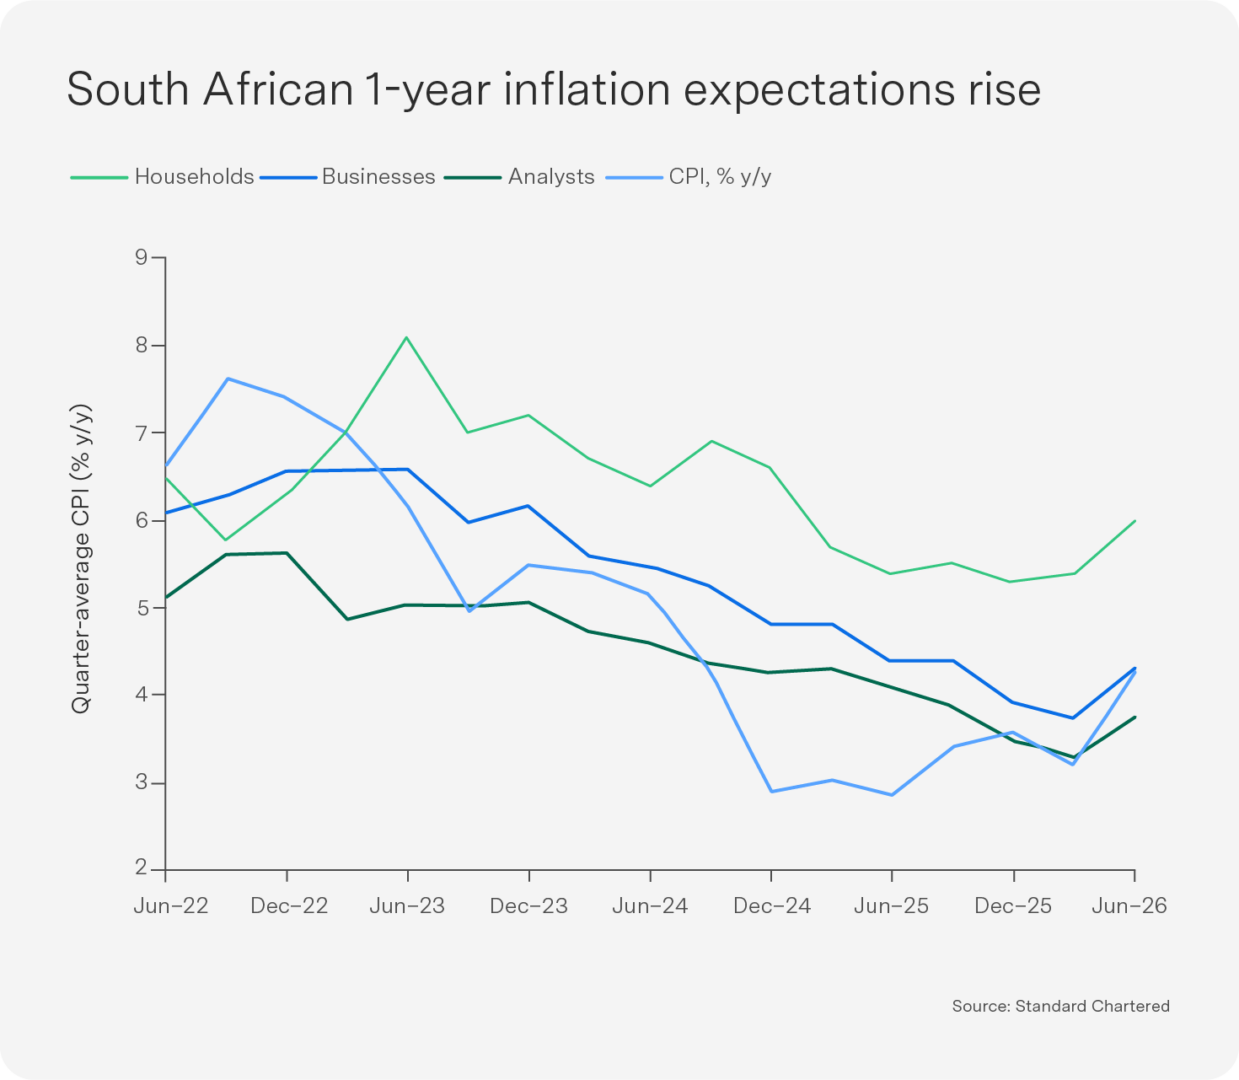
The South African Reserve Bank (SARB) held its policy rate at 7% in July, despite building inflationary pressure – June inflation rose to 5%, above the 4.7% consensus estimate, and one-year inflation expectations also continued to rise (see chart). The decision reflects a deliberate trade-off: by prioritising support for weak growth over containing inflation, the SARB’s hold is equity-positive, but it weighed on bonds and the rand, which both reacted negatively to the surprise. We remain underweight SA bonds.
A separate, more structural tailwind is emerging from gold. China’s continued buying is underpinning longer-term positive sentiment for the metal: it increased its gold reserves by 14.9 tonnes in June, the largest monthly increase since October 2023. EM central bank purchases have been the primary structural support for gold since 2022, and continued buying could help stabilise prices, a positive for SA resource stocks and, by extension, SA equities more broadly.
Given the sharp fall in SA equities and these emerging tailwinds, we have upgraded South African equities to neutral. Domestically, risks remain: the SARB noted that “municipal dysfunction has become a binding constraint on growth”. National Treasury is attempting to address this by temporarily withholding funding from underperforming municipalities, but resolving the underlying crisis will take time.
Outlook: Tariffs return as inflation and oil risk compound

Brent crude rose above US$100/bbl as continued US-Iran hostilities and Houthi attacks in the Red Sea raise the risk of simultaneous disruptions across the Strait of Hormuz and the Bab-el-Mandeb, two critical Middle East shipping routes. Despite these headwinds for oil, the global economy is experiencing a period of exceptional revenue and earnings growth, driven by a wave of AI-related demand. Even in the event of a continued ceasefire, however, several risks remain:
- Inflation pressure is not just about crude oil, it is also tied to refined products such as natural gas, diesel and jet fuel.
- With the US labour market showing renewed strength, the Fed has room to keep its focus on core inflation, which remains well above target.
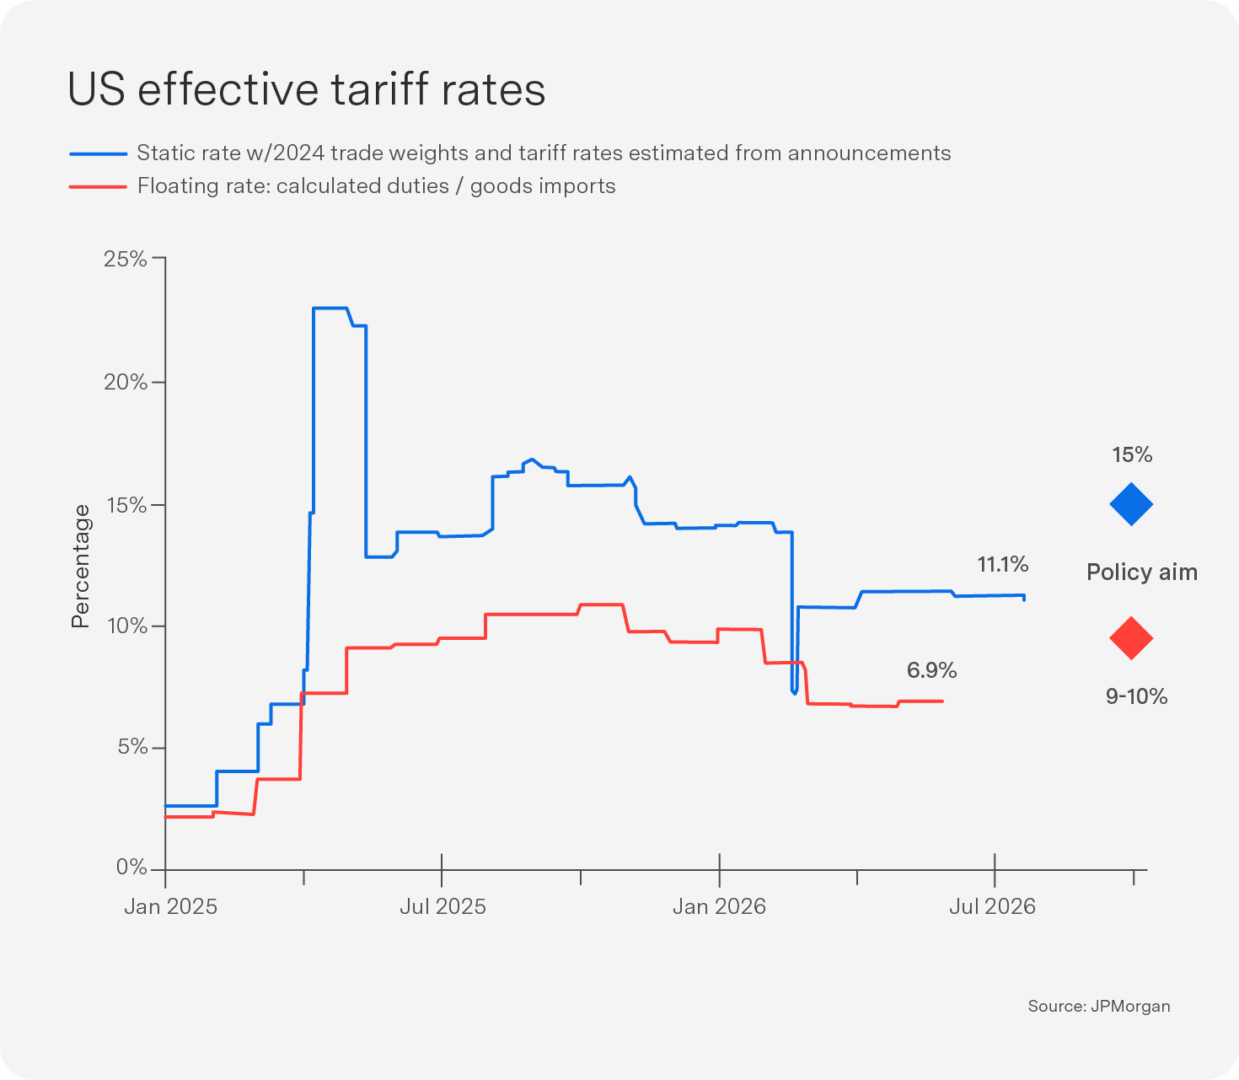
- Tariffs are back in focus. On 24 July, Trump implemented Section 301 forced-labour tariffs as his stop-gap Section 122 tariffs expired; South Africa faces a 12.5% rate under the new measure. On net, this slightly reduces the effective tariff rate in the near term (see chart), but Trump has warned the US will impose a fresh 50% tariff on roughly 5% of Canadian goods under Section 338, a never-before-used legal provision. The Canada measure alone would have limited effect, but it could be applied far more broadly across industries and countries if validated by US courts, suggesting tariffs are likely to increase rather than decrease.
- Taken together, EM economies face a compounding drag from Hormuz-driven oil risk, tight refined-product supply, a hawkish Fed, renewed tariffs and dollar strength. This supports our neutral stance on EMs as the more cautious positioning relative to global equities. Overall, with no recession in sight, we remain cautiously overweight global equities, neutral EM and underweight South Africa.
Key indicators