Rate hikes and credibility recovery: Fading the bond underweight

Markets fell in September as energy prices soared 20%, forcing central banks around the world to hike interest rates – including the Federal Reserve (the Fed), European Central Bank (ECB), Bank of Japan (BoJ) and the South African Reserve Bank (SARB). Oil above $100/barrel will drive global growth down and inflation higher, a toxic mix for markets, but 2026 is also the third consecutive year in which central banks have projected an “immaculate disinflation” (a reduction in inflation while maintaining growth) that failed to materialise. While tariff-driven inflation has passed its peak and energy inflation is expected to peak in Q3, a new concern is AI capex-driven inflation, which is only expected to peak in Q4 or early 2027.
In the US, higher than expected inflation led the markets to price in a 94% chance of a September rate hike and, despite pressure from President Trump to not raise rates, new Fed chair Kevin Warsh blinked first and raised the Fed funds rate by 25 bps, its first hike since July 2023. The committee’s decision was unanimous, and they anticipate at least one more hike this year. The hike was crucial for the credibility of both Warsh and the Federal, so we can now move past that distraction to the true drivers of bond yields.
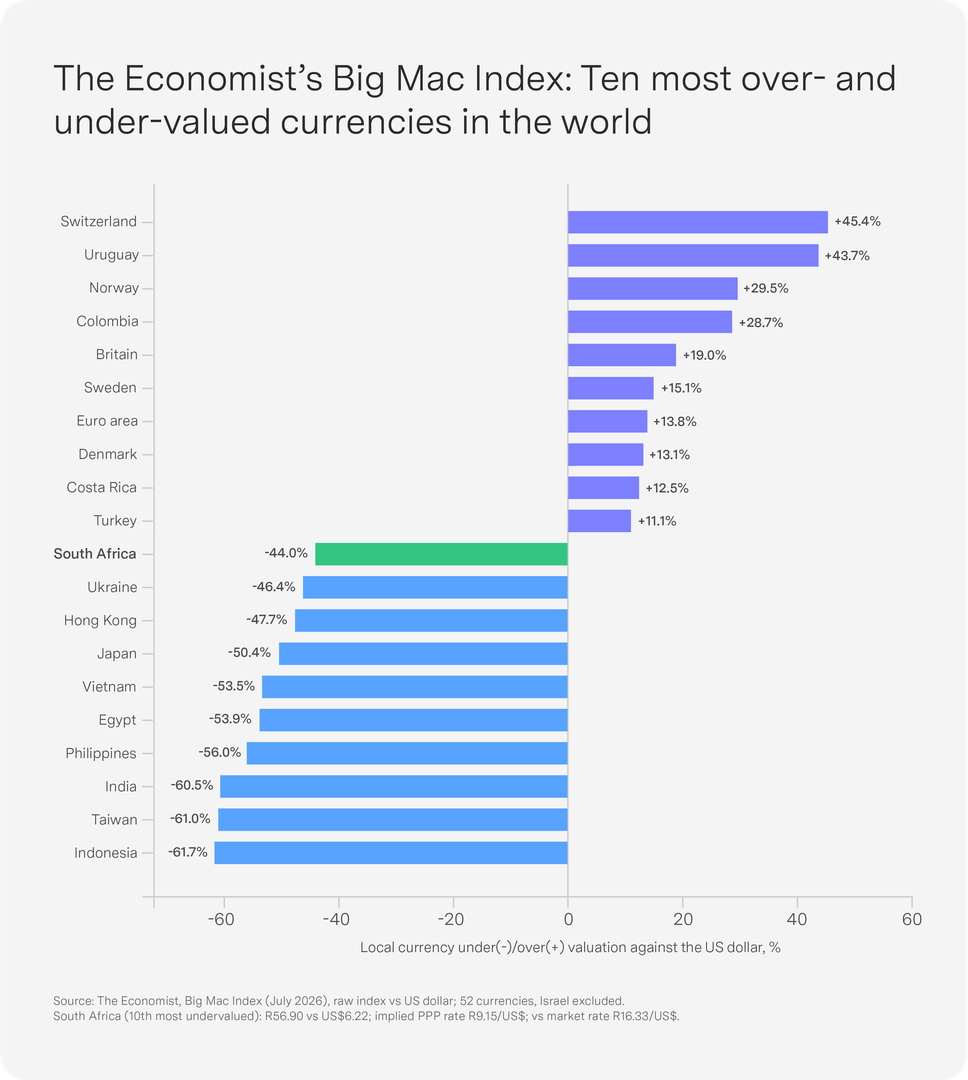
While the US fiscal deficit is irresponsibly large at 6% of GDP, Alpine Macro’s research shows historically little correlation between inflation and the size of budget deficits – it is the change in the deficit that drives inflation. US breakeven inflation is around the middle of the post-2021 range and well below 2022 inflation-shock highs (see chart). Despite renewed oil-driven inflation headlines tied to the conflict in the Middle East, there is no evidence that markets are pricing in a loss of Fed credibility on the inflation channel. Similarly, rising real yields reflect stronger growth expectations and a normalisation of the term premium to pre-quantitative easing historical levels.
There is little global evidence that developed market (DM) government bonds carry a fiscal risk premium: the 30-year/10-year yield spread, a rough gauge of long-term fiscal sustainability concerns, has fallen (suggesting a reduction in concerns) over the past year and now sits below its historical median. Rising bond yields are not a US-specific story: yields have risen more in Germany, the UK and Japan in recent weeks than in the US, suggesting a broader global bear market in duration – driven by strong growth, oil prices, AI/hyperscaler-related corporate borrowing issuance and ongoing quantitative tightening by the BoJ and ECB.
Given the lower credibility concerns, we have reduced our global bond underweight, funded from US cash, to diversify away from the dollar and lock in higher yields. We will remain slightly underweight global bonds until we see a fall in the oil price and a normalisation in growth or a stabilisation in fiscal rhetoric.
The Big Mac Index and the rand’s “true value”

I have a weakness for chocolate. When I travel abroad, I look for my favourite chocolate bar to satisfy my sugar cravings. But you may have noticed a significant price difference in the same chocolate bar in say, the United States (US) relative to South Africa. My sugar hit of preference costs $2 in the US, which, given the market exchange rate of USD1:ZAR16.5, costs me R33 on my debit card (excluding bank fees!). Yet this same chocolate is only R20 at home. This means that the purchasing power of my rand at home is actually stronger than it is according to the official exchange rate. This is the essence of purchasing power parity (PPP). In my example, the rand at PPP levels is actually ZAR10 to the USD and not ZAR16.5. After a purchasing power comparison, the rand is actually undervalued by about 39%.
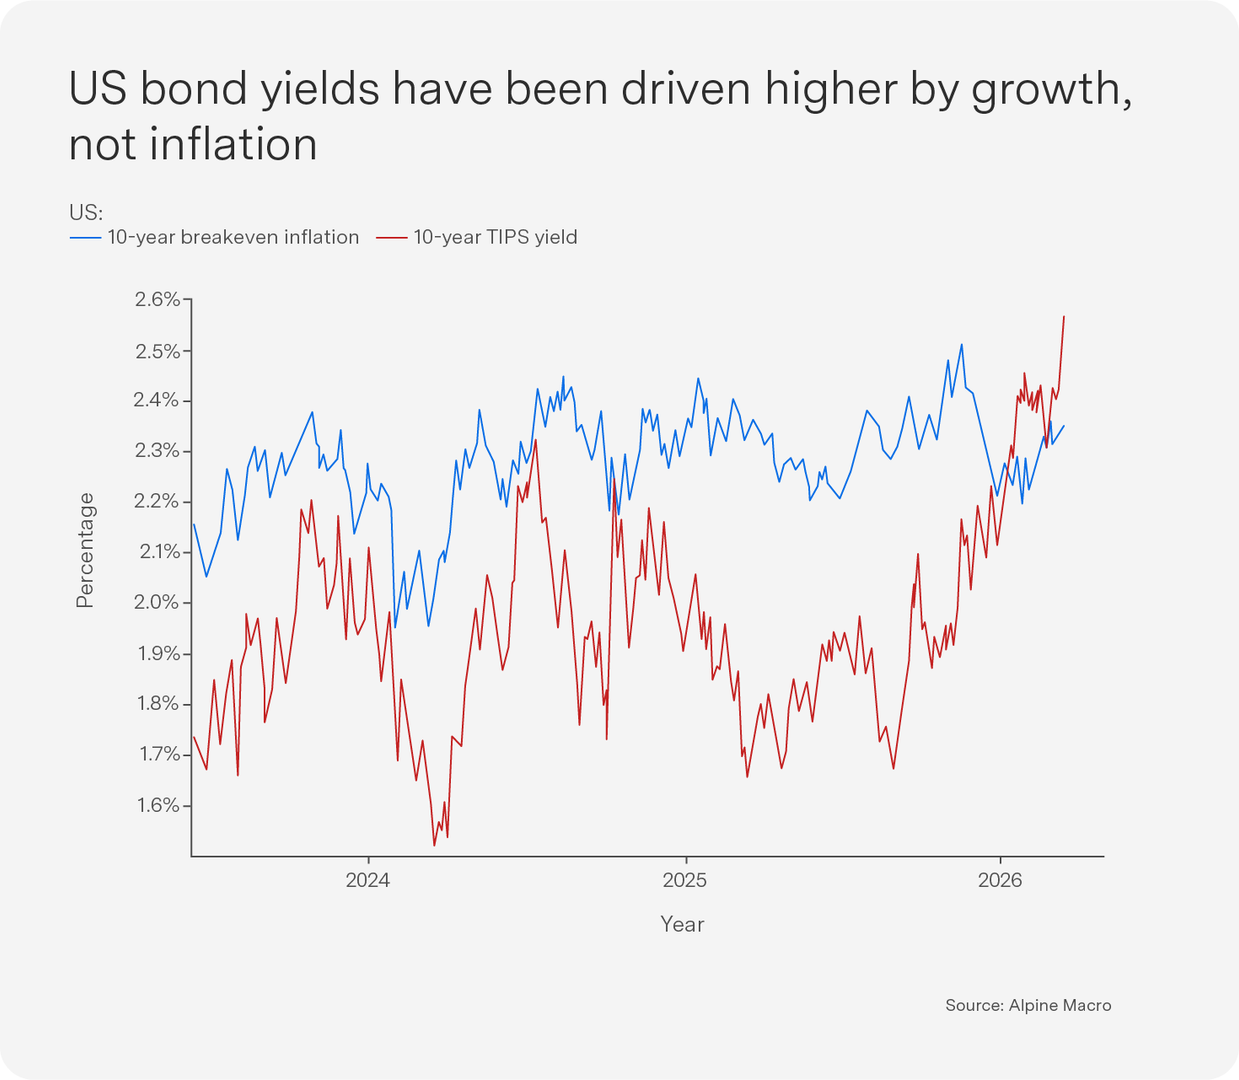
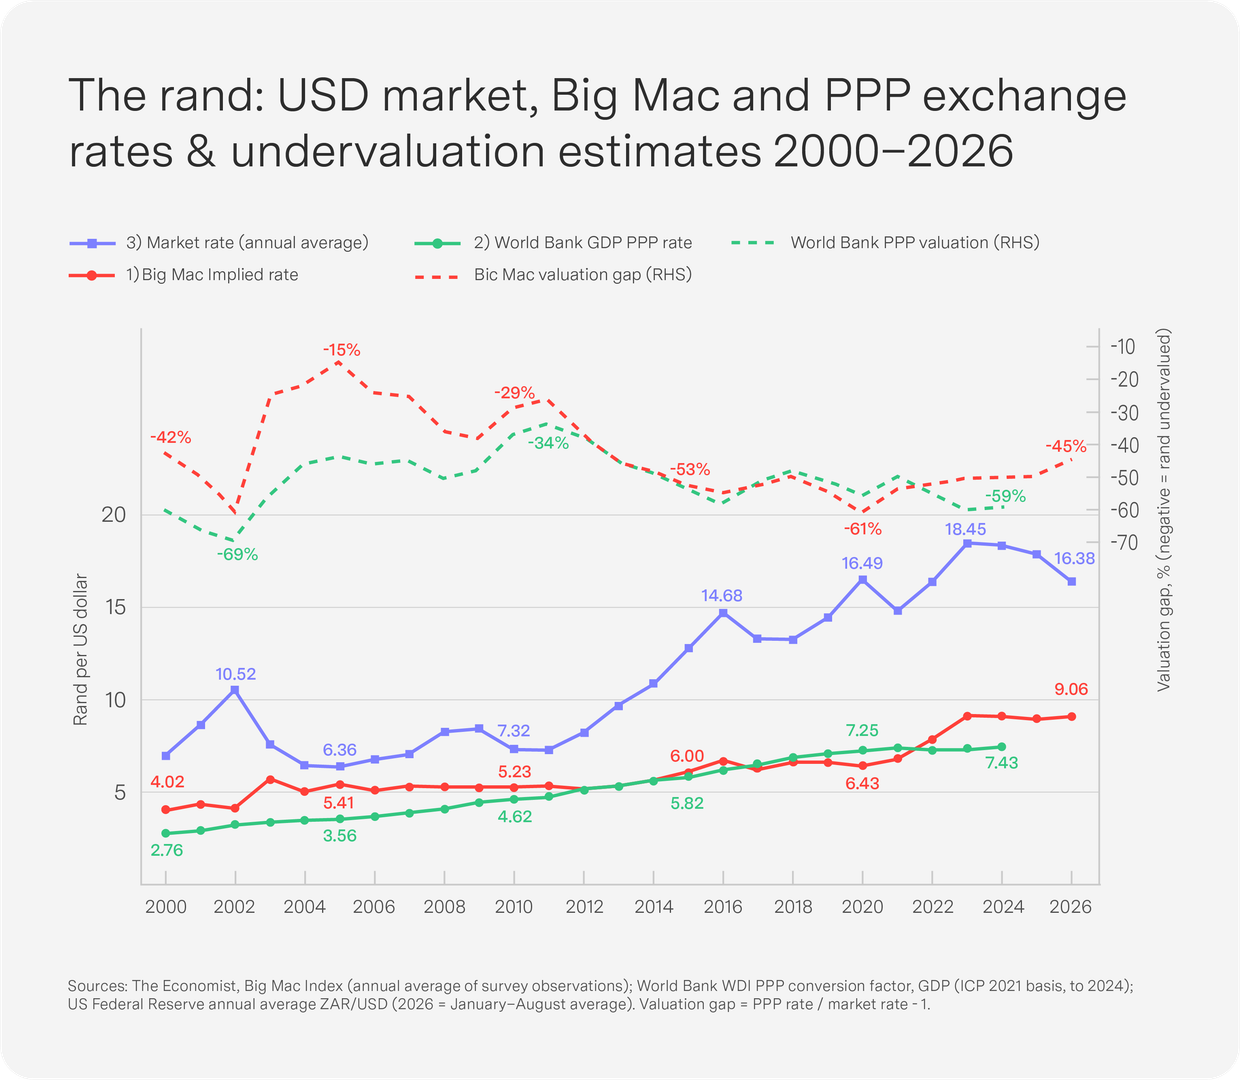
My chocolate example is nowhere near as elegant or globally obvious as The Economist’s famous Big Mac Index. First introduced some 40 years ago, what started as a light-hearted attempt to compare the purchasing power of currencies around the world is now a regular feature of global media coverage. In the most recent edition (representing currency valuations for 2025), the Big Mac Index delivers a common result for the rand: a Big Mac costs R56.90 in Johannesburg and $6.22 in the United States, implying that the rand in PPP terms should be valued at about R9.15 to the dollar. With the currency hovering between R16.20 and R16.50 over the past month, the rand appears some 44% undervalued (see chart). Globally, this suggests that the rand is one of the ten most under-valued currencies in the index. Currencies from Japan and Taiwan to Egypt, Indonesia and India are similarly undervalued, ranging from as much as 44% to 62%.
However, the problem with the Big Mac Index is that, like my chocolate, it measures just one product. A more exact way of measuring PPP across countries is to derive a comparable basket of goods and services, as in the World Bank’s International Comparison Program (ICP). The ICP prices hundreds of goods and services across household consumption, government services and investment goods, and aggregates them into a PPP conversion factor across countries. It uses the same principle as the Bic Mac or chocolate bar comparison, but aggregated across a much greater number of products and services. They key, of course, is that items must be similar. For shoes, for example, the ICP takes a basic mass-market casual shoe in South Africa (e.g. from Woolworths, Edgars or Ackermans) and compares it to the same product in the US from Target or WalMart. Another category is the standard local commuter bus fare, such as Rea Vaya or Putco, relative to a US equivalent such as the MTA in New York City.
Based on these multiple comparable products and services, the World Bank determines GDP figures in PPP terms across countries to derive a much more accurate assessment of comparable GDP. For 2024, the World Bank measured South Africa’s GDP in PPP terms at about $989 billion. Using the current nominal GDP of R7.35 trillion implies a PPP rate of approximately R7.40 per dollar – not R9.15 to the USD as the Big Mac Index suggests, but even stronger. Expressed differently, the rand is even more undervalued, at about 55%, compared to the Big Mac undervaluation of 44%. If we only compare a household consumption basket, excluding investment and government, the PPP rate comes in at R7.80 to R8.00 to the USD. The World Bank number suggests South Africa’s rand has much more purchasing power than the market exchange rate suggests.
The graph below brings these data together to very clearly to show that the rand has essentially been undervalued by anywhere between 15% to 70% over the last 30-odd years. A significant, ongoing and persistent penalty in markets belies the rand’s strong purchasing power at home. Furthermore, the undervaluation gap has expanded over time – shown perhaps more vividly by the market exchange rate relative to the World Bank’s PPP rate. In PPP terms, though, the rand has weakened against the dollar. In 2000, the PPP was R4.00 to the USD; now it is above R9.00.
There are any number of explanations for this discrepancy, but the simplest way to think about it is that the PPP rate measures what the rand buys at home, while the market rate measures what global investors are prepared to pay to hold it. Investors price the rand as a financial asset, not as a basket of goods. I see three core drivers of this gap. First, a persistent risk premium: investors demand a discount to hold rand assets because of our sub-investment-grade sovereign rating (last year’s S&P upgrade notwithstanding), a fiscal risk premium in the wake of state capture and more than a decade of pedestrian growth. Second, the rand is a deep, liquid currency that global investors use as an emerging market proxy – so in any global “risk-off” moment, the rand is sold off rapidly, irrespective of our domestic fundamentals. Third, the rand remains at its heart a commodity currency, rising and falling with gold and platinum-group-metal prices and the fortunes of the US dollar. None of these factors are captured in the price of a Big Mac, nor even in the World Bank’s much broader basket – and cumulatively they translate into a market rand that deviates considerably from the more mechanical (but arguably more relevant for households!) PPP rate. The graphic below captures this well. The undervaluation gap expanded to almost 70% during the 2002 currency crisis and again to more than 60% at the height of Covid in 2020. Conversely, the rand’s strength in 2026 – on the back of the metals price surge, a weaker dollar and an improved sovereign ratings outlook – has narrowed the Big Mac gap to 45%, its lowest level in more than a decade. The lesson is simple: only by chipping away at the risk premium – through fiscal credibility, faster growth and policy certainty – will the rand close the gap on its PPP value.
More positively, these PPP measures are suggestive of a higher GDP per capita figure, which is actually closer to about USD16 000 than the USD7 500 of market exchange rates. This means we have more than double the standard of living in South Africa when measured in PPP terms, rather than a simple market rate USD to ZAR conversion. So what is described rather glibly by many of us as being a much higher standard of living and quality of life in South Africa is reinforced and supported by the numbers. Of course, this still makes foreign holidays and trips inordinately expensive as we convert our hard-earned rands into foreign currencies!
Top 5 funds

The weaker rand over September meant only global funds could find a place in the top 5. Despite weak markets caused by higher oil prices, tech bounced back on strong AI demand after the very positive reception to Meta’s Muse AI agent. Bitcoin led the month (despite disappointing regulatory news on the US Clarity Act), and a semi-conductor rally supported the FANG, 4IR and EM funds.
Emerging markets (EMs) remain king over 12 months, but South Africa has mostly dropped out, with global funds now moving ahead.
1-month absolute performance as at 29 September 2026
- Sygnia Life Bitcoin Plus Fund: 7.9%
- Sygnia Itrix FANG.AI Actively Managed ETF: 3.8%
- Sygnia Itrix 4th Industrial Revolution Global Equity Actively Managed ETF: 3.8%
- Sygnia Itrix MSCI Emerging Markets 50 ETF: 3.7%
- Sygnia 4th Industrial Revolution Global Equity Fund: 3.1%
12-month absolute performance as at 29 September 2026
- Sygnia Itrix MSCI Emerging Markets 50 ETF: 38.3%
- Sygnia Listed Property Index Fund: 20.0%
- Sygnia Itrix MSCI Japan ETF: 16.8%
- Sygnia Itrix 4th Industrial Revolution Global Equity Actively Managed ETF: 15.7%
- Sygnia 4th Industrial Revolution Global Equity Fund: 14.9%
US: Midterm elections raise risks, but AI keeps growth robust

The US midterm elections to be held on 3 November will shape Trump’s ability to execute his agenda. His net job approval has fallen into negative double digits, and Republicans are likely to lose the House; the future of the Senate is less certain, though the latest data on Polymarket suggests the Democrats will win the Senate too. Conventional Wall Street wisdom holds that a split Congress is good for stocks: gridlock gives government fewer chances to disrupt markets, letting companies and investors focus on earnings growth without worrying about major policy shifts. Today’s environment is very different, however, as the current budget crisis calls for a government with enough cohesion to push through difficult reforms – something gridlock makes harder, not easier. If the Democrats should take both the House and the Senate, Trump could face new conduct investigations and a very limited ability to drive domestic policy, which could see him testing the limits of his executive power even further.
At the heart of this political calculus is a simple question: Who will blink first, Trump or Iran? Iran wants to keep oil prices high into the midterms to hurt Trump at the polls. Trump, meanwhile, cannot easily back down and cut a deal. A humiliating defeat ahead of the midterms would be politically disastrous, as voters punish presidents who lose wars (as Joe Biden discovered after the botched 2021 withdrawal from Afghanistan). While this standoff is likely to persist until the midterm elections, overwhelming US military force and Iran’s waning economic strength suggest that Iran will eventually agree to some reopening of the Strait without securing meaningful control over it.
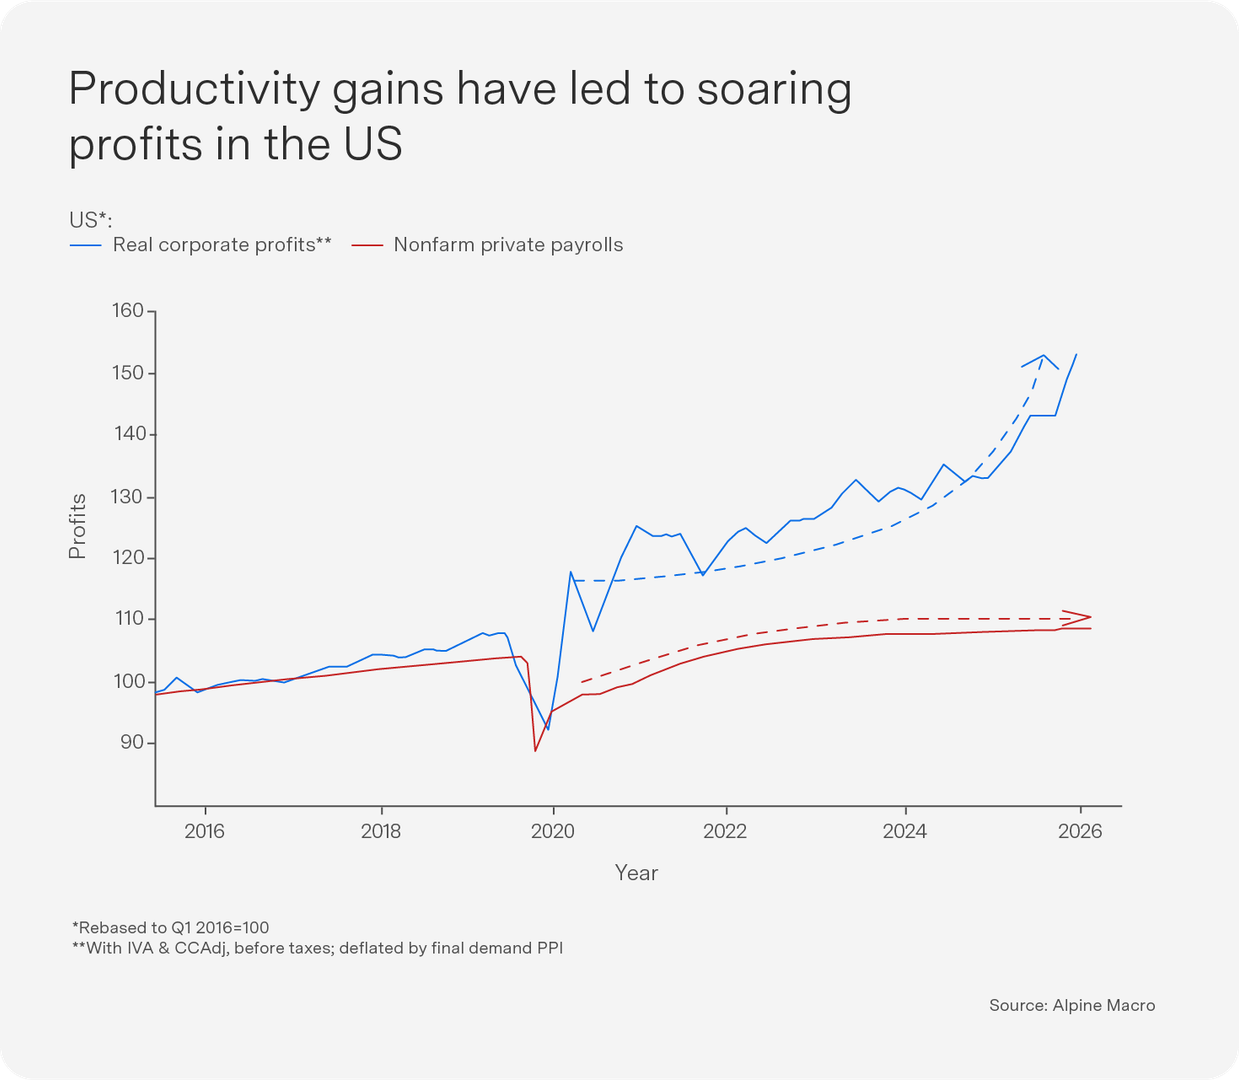
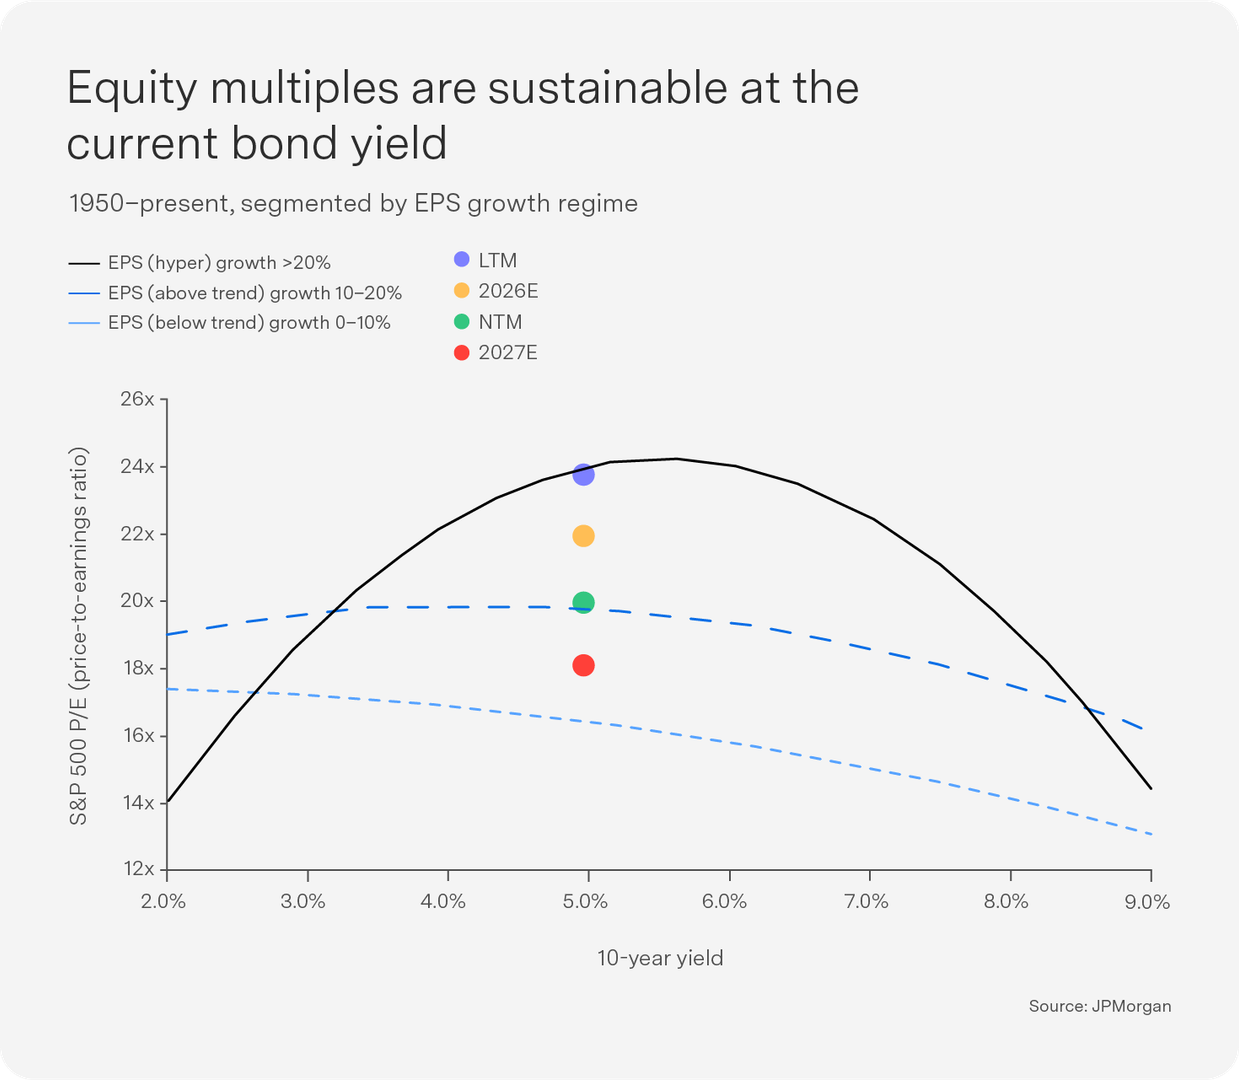
Against this geopolitical backdrop, US bond yields have reached a two-decade high, rising above 5% and putting pressure on both borrowing costs and equity valuations. However, bond yields have been driven higher by real rates as growth expectations rise on the back of booming AI profits and capex, a development that is less threatening to stocks than are rising inflation expectations. JPMorgan historical analysis suggests that, given current growth strength, 10-year bond yields at 5% should not trigger a bear market in equities. The S&P is trading at a 20x forward price-to-earnings (P/E) ratio – above its long-term average – which can remain broadly supported as long as companies deliver 13–15% annual earnings growth over the next few years, consistent with a hypergrowth cycle tied to the AI supercycle (see chart). We remain overweight global equities.
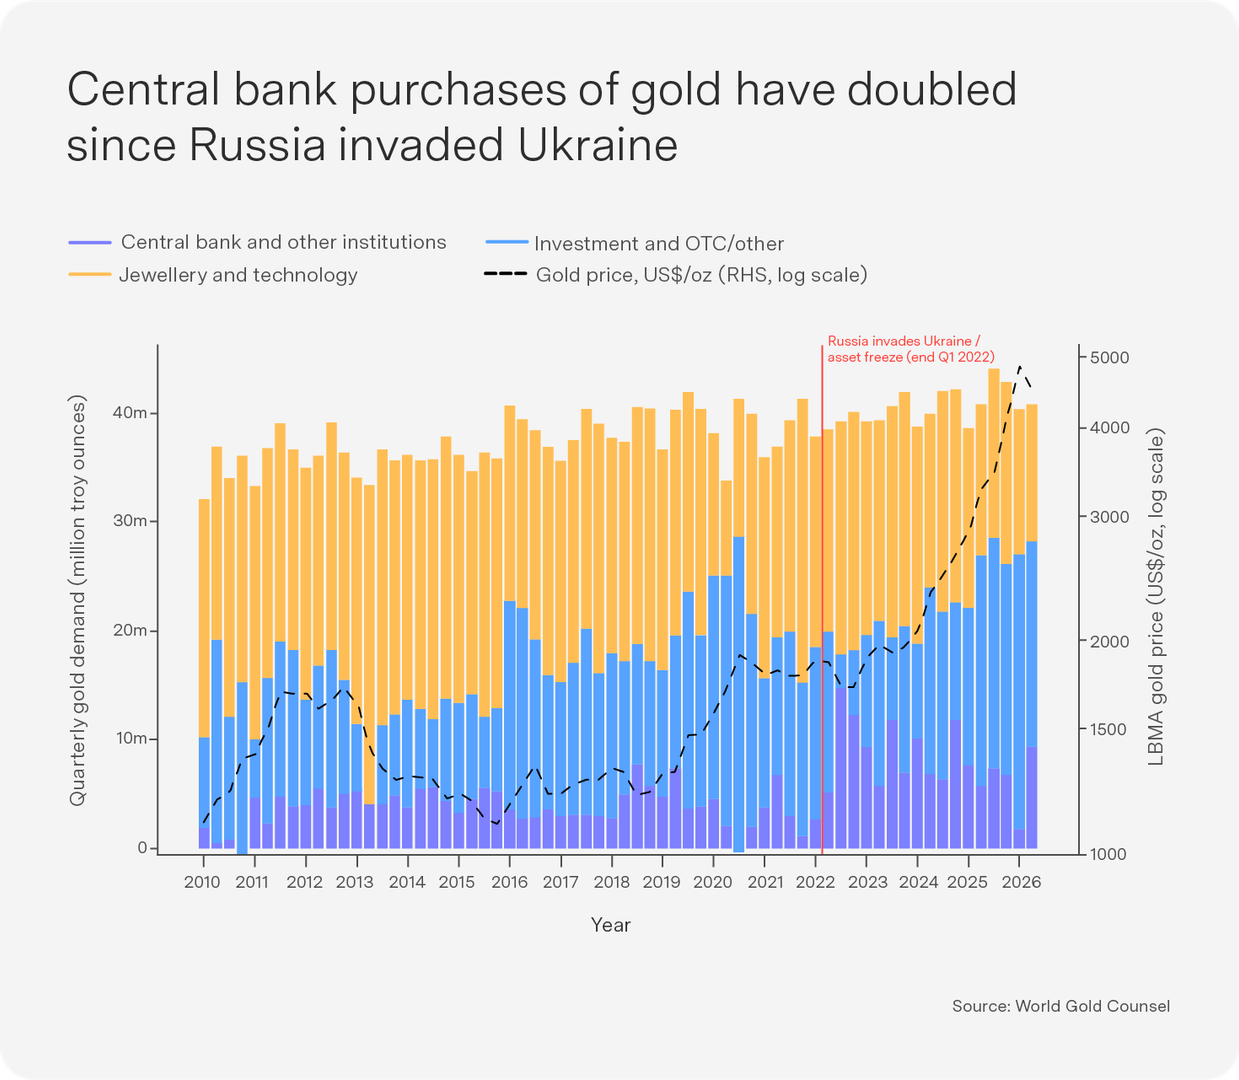
Central banks go for gold – but we prefer the broader commodity basket

Central bank gold demand has strengthened materially. Net purchases rose to 289 tonnes in Q2 2026, a fivefold increase on Q1 and the strongest Q2 on record. China reported its biggest monthly purchase in nearly a decade in August, extending a 22-month consecutive buying streak. Central bank purchases have roughly doubled as a share of the physical market since Q1 2022, when the US froze Russia’s dollar assets, from around 10% of quarterly gold supply pre-war to roughly 20% post-war (see chart). This is a structural shift in the composition of demand. Total gold supply is relatively stable, growing only around 1–1.5% a year (in line with investment demand), as mine production and recycling cannot respond quickly enough to price in the short term. With supply essentially fixed, higher prices have forced the price-sensitive demand categories to shrink as a share of the market – jewellery and technology demand are both roughly 20% lower as a share of supply than before the war – to make room for the growing central bank share.
Central bank purchases have helped raise gold’s structural floor since Russia’s invasion of Ukraine, even as 10-year real yields have risen sharply over the same period – which would normally push gold lower. De-dollarisation post the weaponisation of the dollar, not the debasement trade, looks like the structural driver of rising gold prices. The two largest central bank buyers, China and Poland, have accounted for nearly 50% of net official purchases over the last four years, and EM central banks are reported to account for 95% of net purchases overall. Gold now makes up roughly 28% of Poland’s reserves and roughly 9% of China’s, compared with the US at around 70–74% and the major European economies (Germany, France, Italy) at around 66–69% – underscoring how much further EM reserve diversification plausibly has to run.
China’s own overseas lending shows the same de-dollarisation pattern at work. More African countries are reportedly redenominating existing USD-denominated debt into renminbi (CNY), and Standard Chartered Research shows CNY’s share of loans to Africa rising from roughly 10% in the mid-2010s to 30% in the most recent data, with the USD’s share declining correspondingly.
US exceptionalism is a notable counterweight to the US de-dollarisation narrative, however, as strong US growth and exceptional AI-related corporate earnings have been genuinely dollar-supportive. Foreign equity inflows into the US hit record levels in Q2 2026; most of this buying being currency unhedged supports the dollar. It is thus more accurate to say that gold is a beneficiary of reserve diversification than that the dollar is a loser on account of it. While the structural theme remains intact, the gold rally has pushed valuations close to their 1980 peak, and gold also recently outpaced industrial metals by three standard deviations relative to its historical trend. As such, we prefer owning a broader commodity basket at this point – particularly copper, which has been a beneficiary of the AI capex rollout.
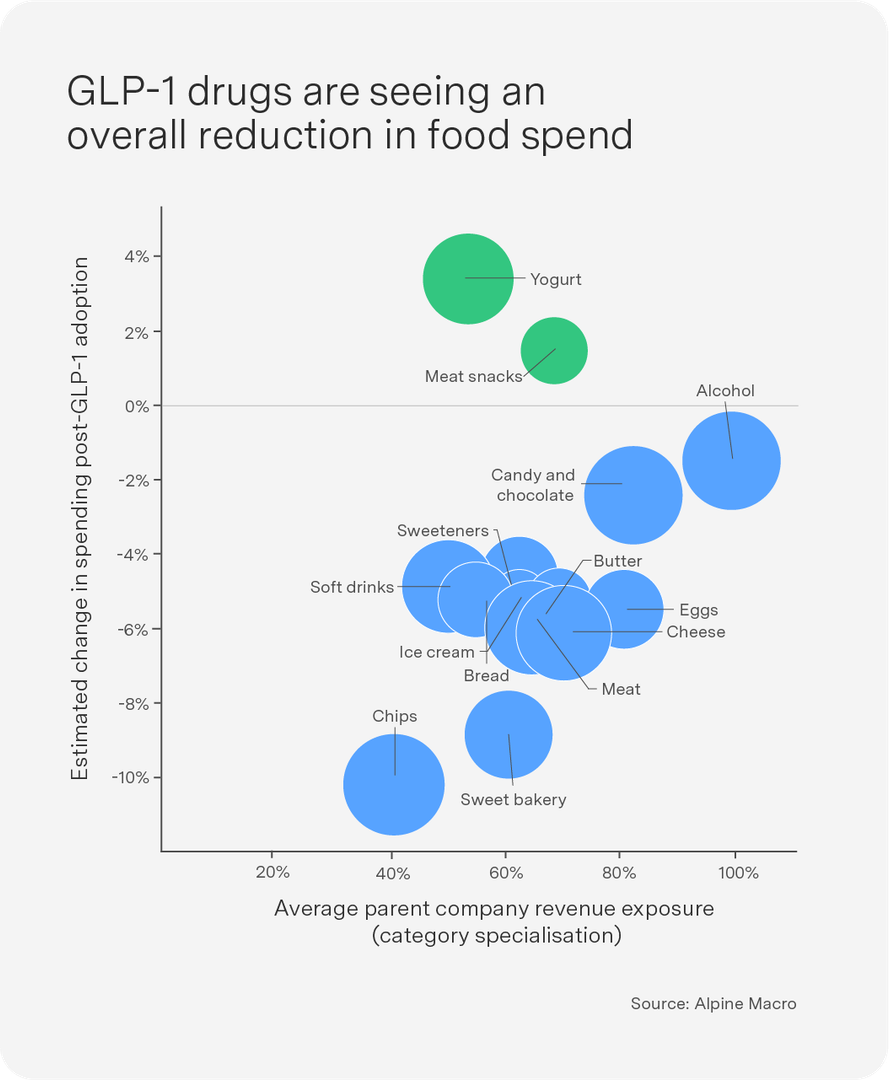
GLP-1 drugs are reshaping consumer staples

GLP-1 weight-loss drugs like Ozempic and Wegovy are hitting consumer staples companies hard, and GLP-1 adoption is still growing fast – about 20% year-over-year. Usage has exploded from under 1 million prescriptions in 2020 to over 11 million in 2026. Households with at least one GLP-1 user cut grocery spending by 5.3% within six months of starting the drug, and higher-income households cut even more at 8.2%. Salty snacks, baked goods, candy and soft drinks are losing the most, while spending at fast-food and quick-service restaurants has dropped 8%. Food distributors are particularly exposed because of the restaurant spending pullback, and even where consumers are trading up to “better” choices, total food volume purchased is still declining overall. Based on Bloomberg analysis, growing GLP-1 use could slash US and European food and beverage sales by as much as $95 billion by 2036, or 2.9% of revenue across the categories we track, up from a 0.4% hit in 2026. We do not have a position in consumer staples and prefer healthcare as a defensive sector.
South Africa: Negative growth, and the trade account blows out

South Africa faces an approaching gas supply crisis as Mozambique’s maturing gas fields decline and liquid natural gas import terminals, meant to bridge the gap, remain delayed due to policy paralysis. In the interim, the cheaper piped gas will have to be replaced by costlier sources, and industrial gas prices are expected to double. This risks feeding into domestic inflation and threatening potentially hundreds of thousands of jobs. Expectations for local municipal elections are for a still-lower ANC vote share, more fragmentation and continued coalition volatility – none of which support reform acceleration or growth.
South Africa’s economy contracted by 0.2% quarter-on-quarter in Q2 2026. The contraction was concentrated in mining, manufacturing, and retail and wholesale trade. Within consumer spending, real quarter-on-quarter declines were seen in clothing, transport, housing, and utilities and communication. GDP growth for the year should still be around 1%, though the oil shock means downside risks remain. While the October Medium Term Budget Policy should be positive due to the precious metal windfall, South Africa’s weaker growth trajectory is now the major risk to South Africa’s debt ratio, threatening to push the debt peak further out. The SARB lowered growth expectations and raised inflation expectations at its September meeting and hiked rates from 7% to 7.25%, which will further constrain growth. The SARB anticipates no additional hikes, but the market is pricing in two more.
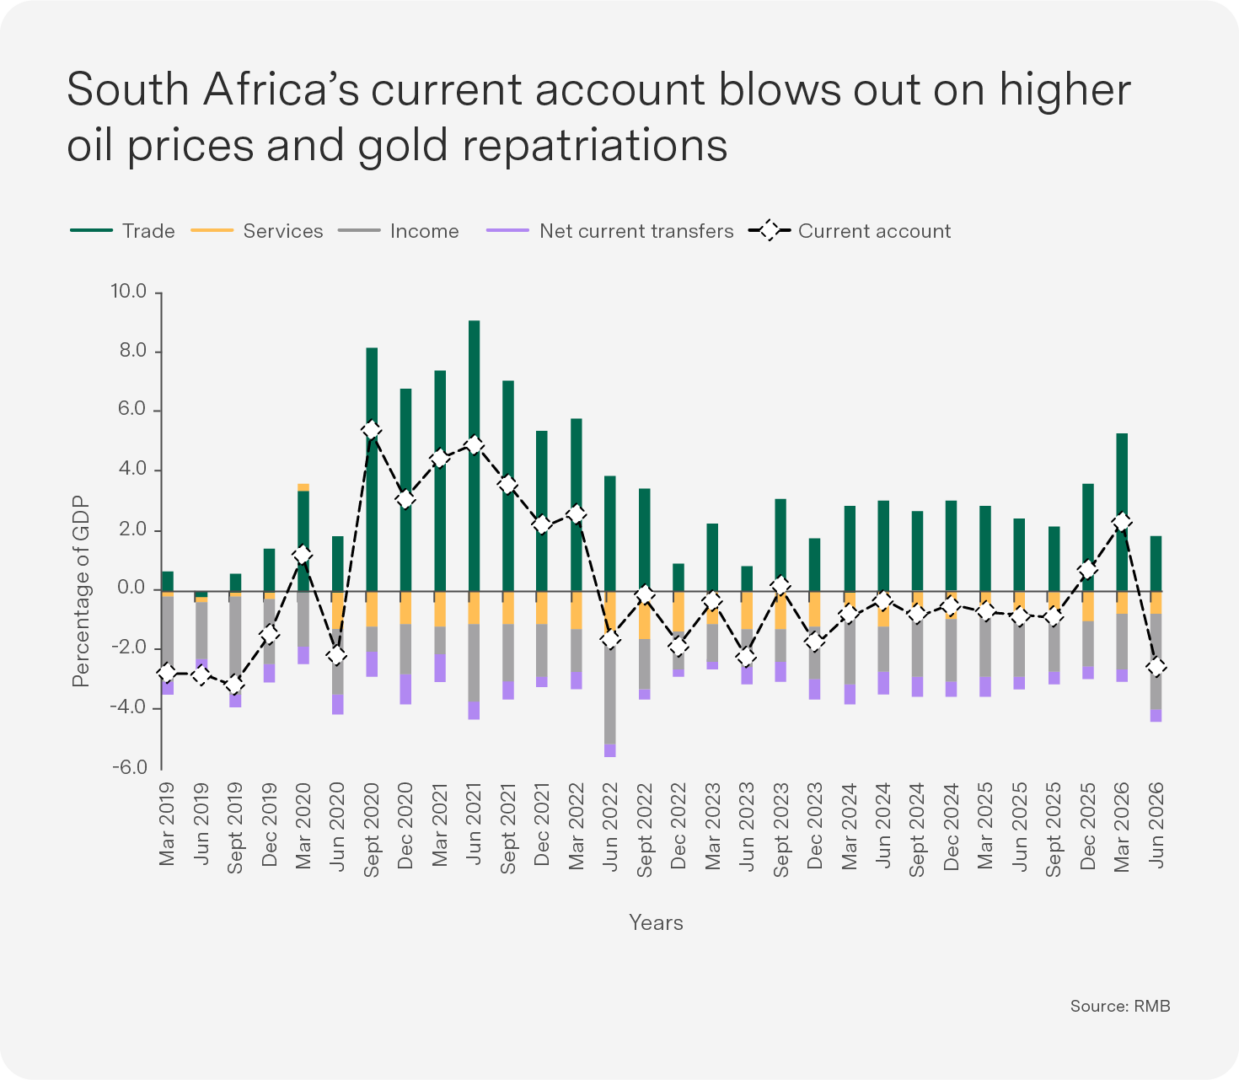
South Africa’s current account also suggests the rand is too strong. The current account fell to -2.6% of GDP in Q2, its worst position since 2019, reflecting both a narrower trade surplus and a material widening in the invisible deficit. Import costs grew due to the higher oil price, which narrowed the trade surplus. The primary income deficit widened materially due to higher commodity-related dividend payments as SA companies repatriated commodity windfall profits to foreign shareholders.
We remain neutral SA bonds, balancing the global EM carry trade with negative fundamentals.
Outlook: Strong growth meets higher oil prices drive

The Middle East outlook continues to vacillate between a deal and annihilation, most likely until the US midterms at least. The status quo since end February has continued, with high, volatile oil prices and record-high refining margins. The global backdrop remains one of resilient growth colliding with an energy and inflation shock.
DM central banks are playing catch-up against inflation that has proven far stickier than expected. The US rate hike restored Fed credibility and, with little evidence of a fiscal risk premium in global yields, we have trimmed our bond underweight to slight.
On commodities, we prefer a broad basket over gold specifically. Central bank de-dollarisation remains a genuine structural tailwind for gold, but valuations are stretched near 1980 peaks, and a broader basket offers commodities benefiting from the AI capex theme. This has kept us neutral SA bonds and overweight SA equities despite the risks of rising energy prices to EM energy importers. South Africa illustrates the risk: contracting growth, a blown-out current account and a fragmenting political landscape.
In global equities, we remain overweight. Growth remains strong partly due to AI capex spend and partly due to excessive government support, which helps offset the higher interest rates. While volatility is likely to remain high as we go into the US midterm elections, an AI-led productivity boom will support earnings growth and eventually push down inflation in the medium term (see chart).