
Is the US Fed going to end the market rally?
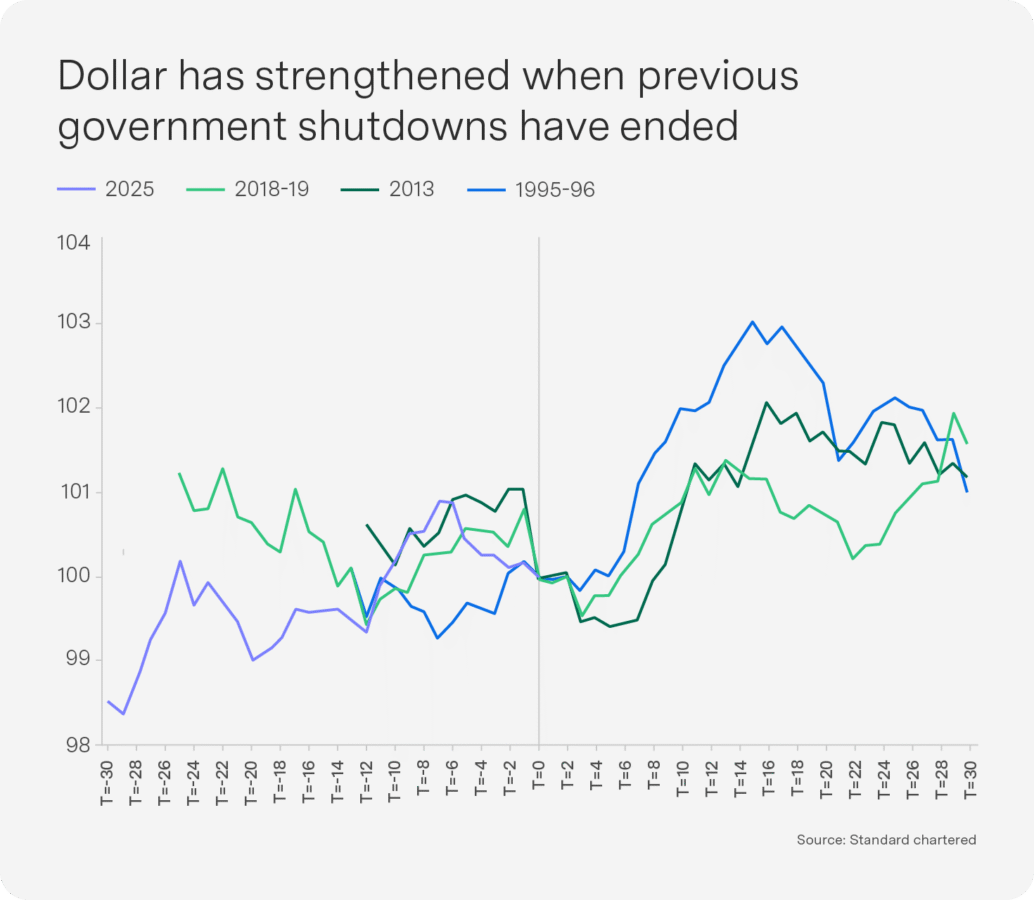
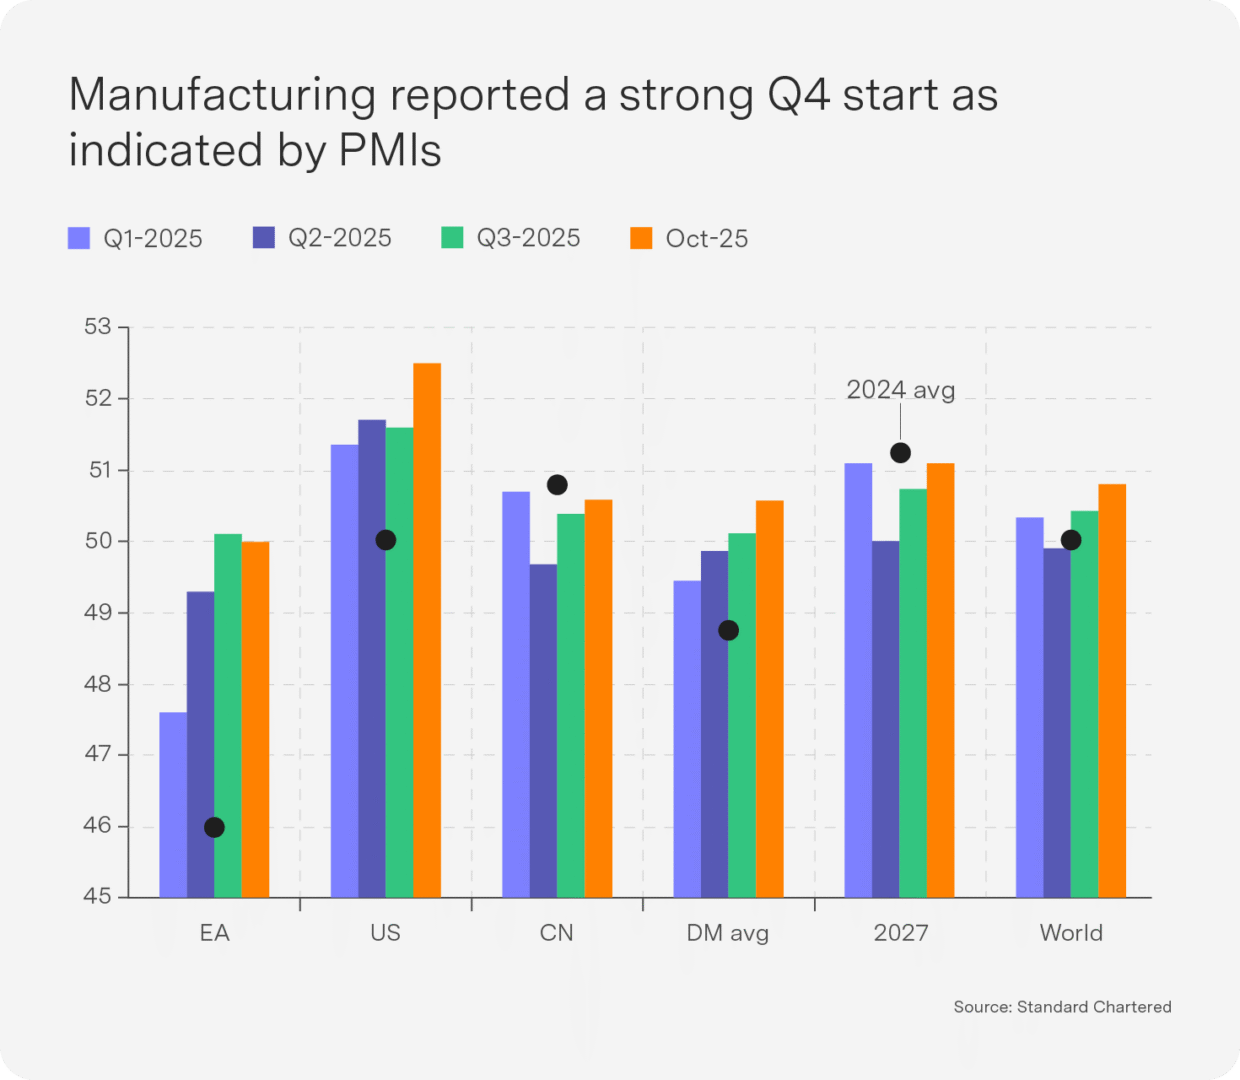
US President Donald Trump signed a temporary funding bill into law, ending the longest US government shutdown on record. However, the law was passed without renewed subsidies for the Affordable Care Act health insurance programme, which could create another impasse in the lead-up to the 30 January budget deadline. The dollar has historically rebounded with the end of government shutdowns (see Chart), as the resumption of public spending and back pay supports economic activity. Based on the latest purchasing managers’ index (PMI) surveys, economic growth is accelerating into year-end across all major regions, with the US leading and the European Union (EU) lagging. US productivity growth has been driven in part by the AI boom. US corporate profits confirm this, with Q3 results higher and broader than expected.
Inflation and employment remain the key risk in the US, but the shutdown means that little applicable data will be available until after the December Federal Open Market Committee (FOMC) meeting. Weak employment remains the biggest reason for the Fed to cut in December. On the inflation side, the oil price has not risen despite EU and US sanctions on Russian oil producers, and the Trump administration has also proposed cutting tariffs on various food items not made in the US to reduce food inflation. However, core personal consumption expenditure (PCE) remains above the FOMC’s target, various cost-of-living measures remain elevated and tariffs and immigration are still threats to higher inflation.
Strong economic growth, robust corporate earnings, deregulation and the end of the shutdown may give the Fed room to proceed cautiously, which would support the dollar. If growth reaccelerates while inflation remains closer to 3% (1% above the 2% target), the central bank should not maintain a highly dovish stance. All eyes are on the FOMC’s December meeting. The October FOMC minutes show that most members were against a December cut, which drove the probability of a December cut down to 24% and catalysed the negative market returns in November. However, dovish comments from the FOMC voting members since then moved the probability back up to a high of 80%, supporting a market recovery. Looking into 2026, the outlook for the dollar is more balanced than 2025 and the Fed should cut less than expected, but political pressure may lead to more cuts than are required. Uncertainty remains high and heightened volatility is expected.
The often overlooked Medium Term Budget Policy Statement (MTBPS): What did it tell us?

The media coverage of the MTBPS is completely overshadowed by the full Budget that follows it. Yet the MTBPS – at least in a fiscally sound and stable environment – arguably contains all the key information and policy decisions already made by the Minister of Finance before his March speech.
And in many ways, the most recent MTBPS did that and then some: It represented a remarkably positive fiscal policy threshold in President Ramaphosa’s time in office. Crucially, this was signalled by financial markets, as South Africa received a credit rating upgrade for the first time in 15 years (from S&P Global Ratings), moving the economy closer to an investment-grade credit rating.
There are five core features of this turnaround. Firstly, the adoption of a lower, 3 per cent inflation target; secondly, the associated decline in projected debt-service costs; thirdly, a recalibrated debt-to-GDP profile; fourthly, South Africa’s exit from the Financial Action Task Force’s (FATF’s) grey list; and finally, a structurally lower public-sector wage bill. Together, these shifts signal an attempt to move the macro-fiscal regime to a more credible, lower-inflation and lower-risk path, even at the cost of accepting short-term narrowing fiscal space. These shifts are discussed in greater detail below.
The first and arguably most far-reaching policy change was the decision to adopt a new point inflation target of 3%, with a tolerance band of 1 percentage point. While National Treasury and South African Reserve Bank (SARB) officials have clearly been debating it for some time, it did have an air of inevitability. By committing to a lower target – as I argued in a previous Sygnals – the authorities are aiming to shift inflation and inflation expectations to a permanently lower path, creating space for structurally lower nominal and real interest rates over time. However, the MTBPS acknowledges that this is not a free lunch: lower inflation reduces nominal GDP growth and tax revenues and slows the erosion, in real terms, of the existing stock of public debt. Hence, in the short term we will take some “negative nominal effects”, as it were – but it is true that if we ride through this early fiscal period, lower (and more stable!) inflation will bring with it a more competitive real exchange rate, lower cost-of-living pressures and a reduced inflation risk premium in domestic asset prices.
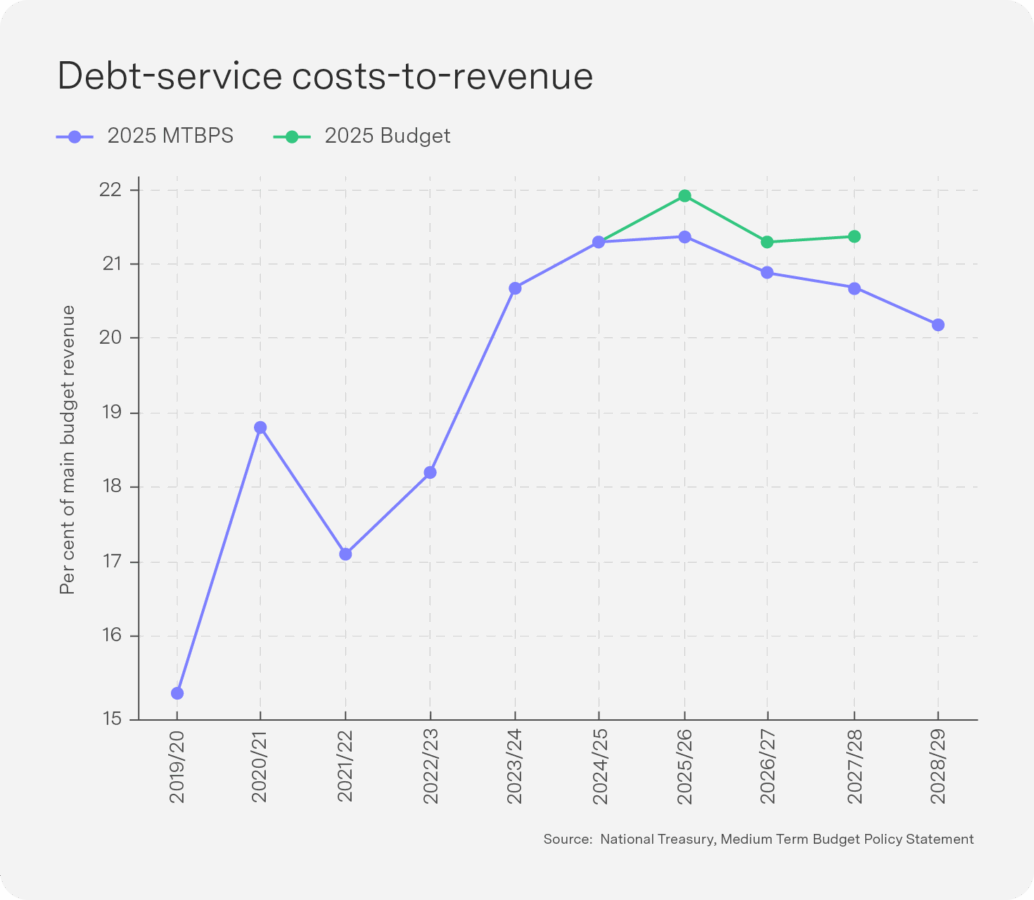
The second feature of this threshold point in fiscal policy revolves around debt-service costs, one of the fastest-growing spending items over the past decade and increasingly crowding out social and capital expenditure. The MTBPS has clearly situated the lower inflation target within the broader strategy of reducing the real interest rate at which government borrows, primarily by compressing the inflation risk premium demanded by investors. A credible and well-communicated disinflation path, coordinated between Treasury and the SARB, should, over time, be reflected in lower yields on government bonds, especially at the longer end of the curve, where expectations about future inflation and policy credibility are most important. Thus, as the existing stock of relatively expensive debt is refinanced at these lower yields, the interest bill becomes more manageable and the ratio of debt-service costs to revenue begins to decline relative to previous baselines. The figure from the MTBPS below is arguably one of the most important fiscal policy statements we have seen for some time: It shows that debt-servicing costs as a share of revenue will decline from 21.3% to 20.2% over the medium-term expenditure framework (MTEF).
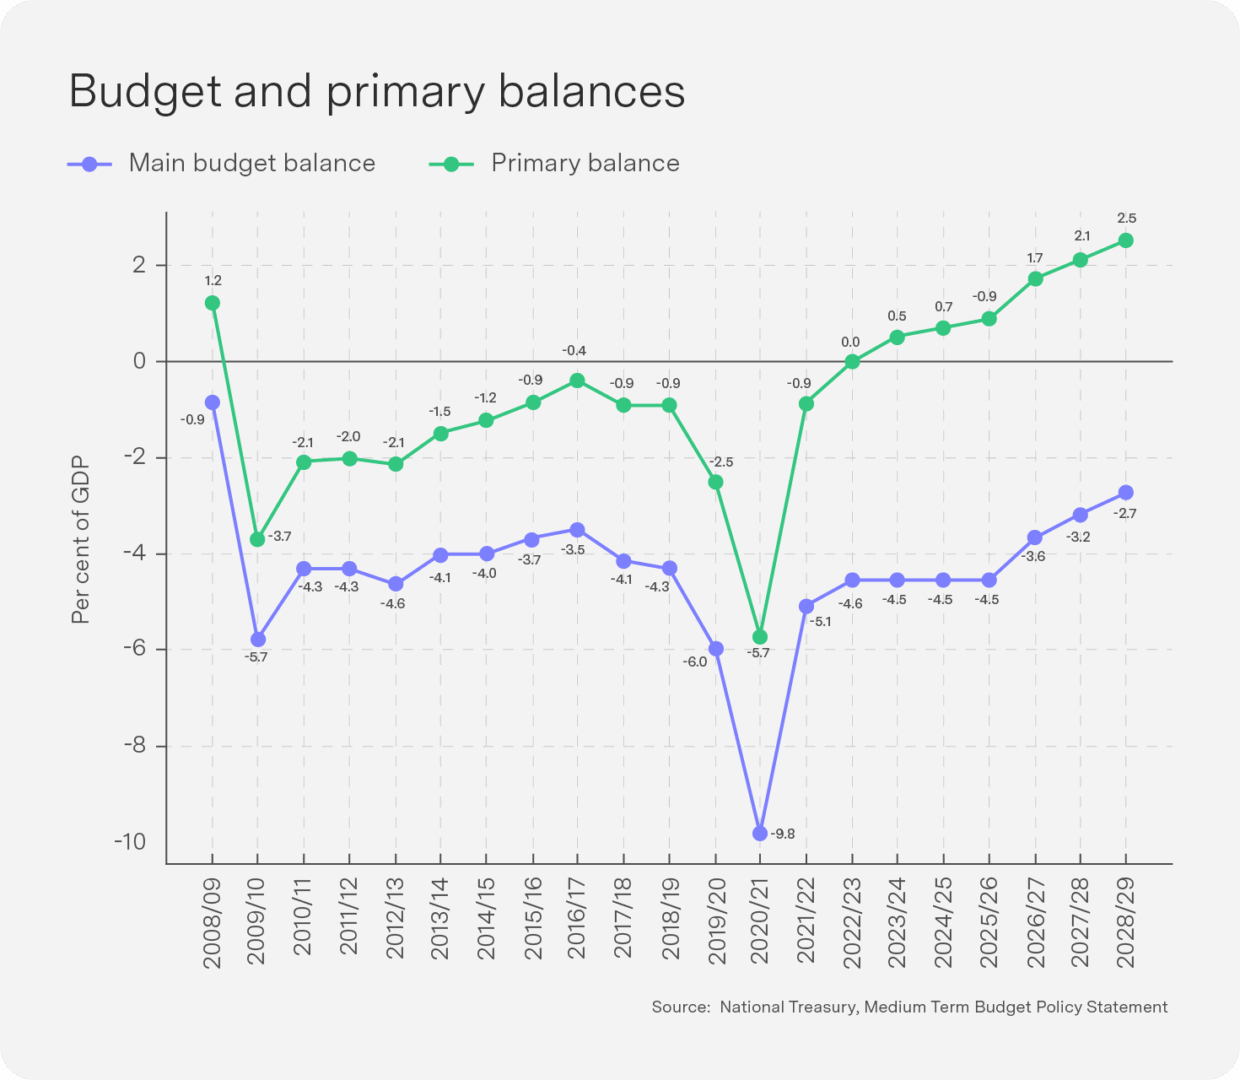
A third threshold lies in the revised projections for the gross debt-to-GDP ratio. On the face of it – as noted above – the new path appears less favourable than that presented in earlier Budgets, with the level of debt-to-GDP now projected to be higher in the short term. The MTBPS is explicit that this is not the result of an underlying loss of fiscal control, but rather a mechanical consequence of adopting a lower inflation path. Nominal GDP now grows more slowly, so while the nominal stock of debt reflects past borrowing and still-elevated interest costs, the ratio of debt-to-GDP is pushed up in the transition period. At the same time, lower inflation slows the rate at which inflation erodes the real value of outstanding debt. These forces run counter to the long-term benefits of a lower-inflation environment. However, this high debt-to-GDP profile must be viewed against a rising primary surplus. Yes, you read that correctly! We have now had a year or two of primary surpluses, and these are set to expand over the MTEF period from 0.5 to 2.5% of GDP. Ultimately, though, the MTBPS is asking markets and citizens to accept a temporary “optical” deterioration in the headline debt ratio in exchange for a more sustainable and less inflation-distorted debt trajectory over the medium to long term.
The fourth important feature that drove our re-rating was South Africa’s removal from the FATF grey list. Grey-listing was associated with heightened perceptions of regulatory and governance risk, and its reversal reflects a multi-year effort to strengthen the anti-money-laundering and counter-terrorist-financing framework, enhance supervisory capacity and improve enforcement outcomes. From a fiscal and macro-financial perspective, exiting the grey list matters because it helps to normalise South Africa’s risk profile in the eyes of global investors and reduces the non-price frictions that built up around financial flows.
Finally, the MTBPS sets out a threshold shift by reducing the public-sector wage bill. Compensation of employees has long consumed a large and rising share of consolidated expenditure, constraining the ability of the state to fund infrastructure and core social programmes. The MTBPS projects more restrained wage settlements more tightly aligned with the new, lower inflation target; promises to strengthen controls on headcount; and targets reductions in the public-sector payroll. The latter includes the removal of “ghost workers” through improved payroll verification and digital personnel systems, as well as the use of voluntary early-retirement schemes and natural attrition to reduce staffing levels in a gradual and socially managed way. The MTBPS is promising a leaner public sector wage bill – whether this will translate into enhanced efficiency is a discussion for another day.
Taken together, these key positive developments in the 2025 MTBPS amount to more than incremental technical adjustments. They represent an attempt to lock in a lower-inflation macroeconomic regime, improve the quality and composition of public spending and reduce the risk premia embedded in South Africa’s sovereign borrowing costs. A massive positive fiscal step in the right direction has been made!
Top-performing Sygnia funds

Berkshire Hathaway recovered over one month after Waren Buffett’s final newsletter and the update of its latest holdings, which included selling Apple and buying Google. Health innovation continued its recovery after last month despite Novo Nordisk hitting five-year lows, and most of the conditions continue to line up for the sector to be a buy – only earnings revisions are lacking. SA bonds reacted very positively to the Medium Term Budget Policy Statement (MTBPS), which also drove SA property.
1-month absolute performance as at 27 November 2025
1. Sygnia Listed Property Index Fund 7.7%
2. Sygnia Itrix Health Innovation Actively Managed ETF 7.6%
3. Sygnia Health Innovation Global Equity Fund 7.1%
4. Sygnia Life Berkshire Hathaway Portfolio 5.9%
5. Sygnia Enhanced All Bond Fund 2.8%
12-month absolute performance as at 27 November 2025
The 12-month ranking was dominated by emerging markets as the Sygnia Transnational Fund rose into the top five – the fund offers a great way to diversify relative to the rather skewed All Share Index, which is heavy in precious metals and banks. Transnational has exposure to companies that primarily have global revenue, so it is focused on the global megacaps listed in South Africa.
1. Sygnia Itrix Top 40 ETF 39.0%
2. Sygnia Top 40 Index Fund 38.6%
3. Sygnia Itrix MSCI Emerging Markets 50 ETF 34.1%
4. Sygnia Transnational Equities Fund 32.9%
5. Sygnia Listed Property Index Fund 30.7%
US: AI stocks face debt pressure and ex-Mag 7 have best earnings in three years

Despite solid results from tech companies and bellwether Nvidia, technology shares led the market lower in November. There are a few reasons for this: firstly, the Magnificent Seven earnings revisions have turned negative over the last three months. Secondly, a basket of bonds issued by the hyperscalers has seen their spread climb to their highest level since the start of the year. This highlights investors’ concerns over tech groups turning to debt markets to finance their massive investments in AI infrastructure. Tech plans to invest $400 billion in AI capex this year, which could result in a depreciation bill of $240bn by 2027. In addition, from around 2020, hyperscalers began extending the depreciable life of their servers from as little as three years to about six years, spreading out the earnings hit from their heavy spending. Meta’s January decision to adopt a five-and-a-half-year useful life for most of its servers and network assets boosted its net income by close to $2 billion in the nine months to September. There is a danger of AI capex becoming a huge recurring depreciation expense in a few years for hyperscalers such as Google and Microsoft. Investors are also getting nervous about how AI companies will monetise this spend. JPMorgan estimates that achieving a 10% return on investments over the next five year could require additional annual revenue of $650 billion – equivalent to 0.58% of global GDP.
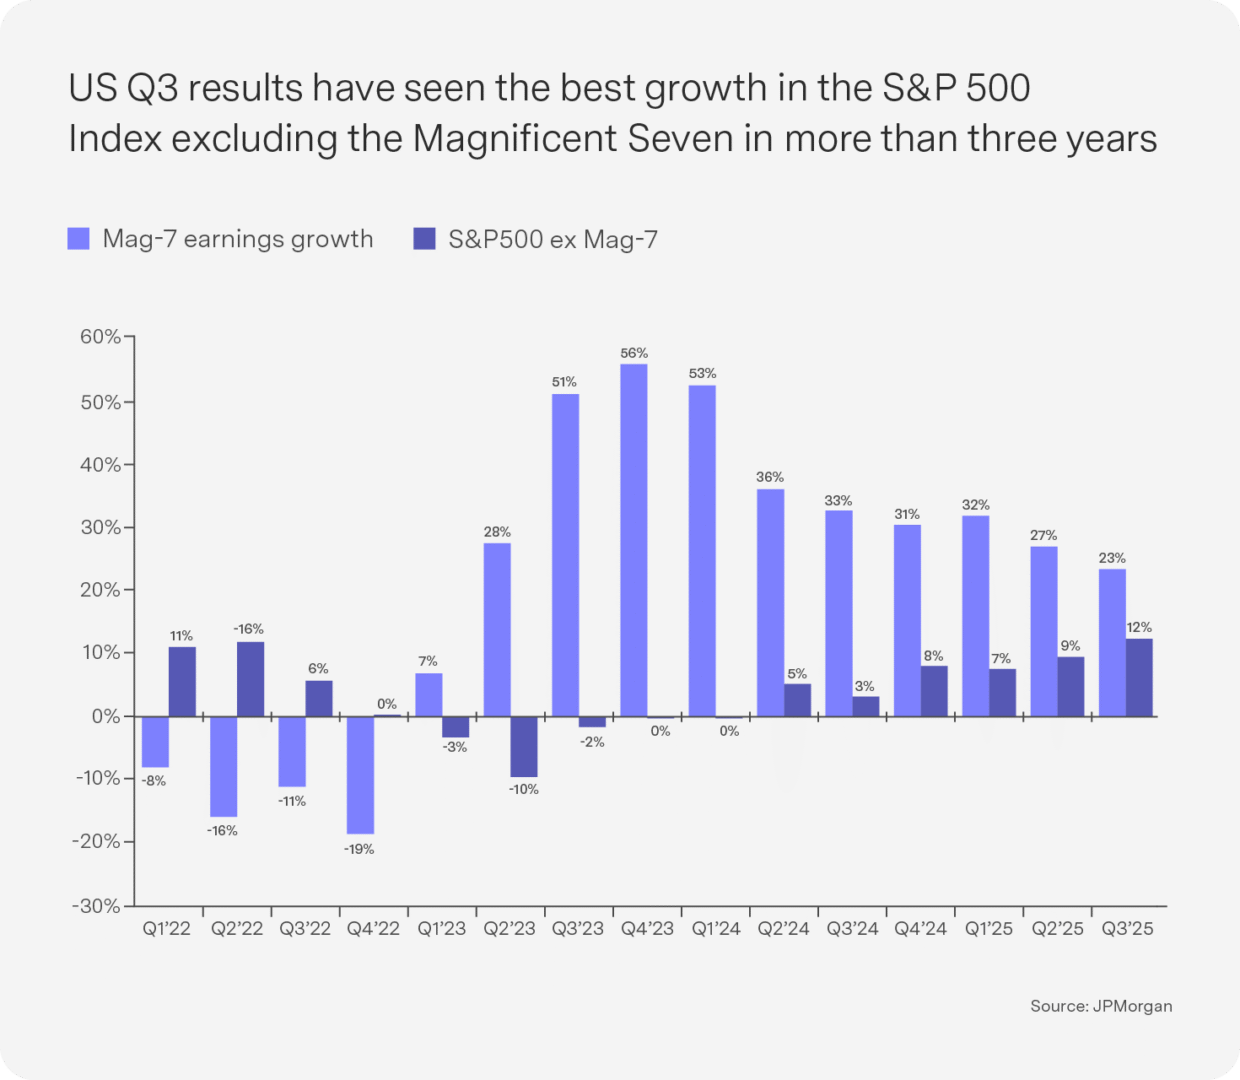
Finally, US Q3 results show the best S&P 500 Index ex-Magnificent Seven earnings growth in more than three years, with the gap between the S&P 493 and the Magnificent Seven narrowing more than expected (see Chart). This recovery in earnings for the broader market allows a rotation out of tech into shares trading at cheaper valuations.
AI to support productivity growth, but it will impact employment

In the long term, GDP growth is the sum of productivity growth and labour supply growth. JPMorgan’s composite global scorecard of several AI preparedness indices from Stanford, the International Monetary Fund, IMD Business School, World Intellectual Property Organisation and Government AI Readiness Index shows that the US is likely to see the largest boost to productivity – and hence economic growth and earnings growth – relative to the rest of the world. China is in second place and South Africa is last. Developed markets dominate the top 10 outside of China and South Korea, while emerging markets (EMs) make up most of the bottom 10, creating an EM structural headwind in the long term (see Table 1).
AI is expected to lift US productivity by more than 1% per annum (and hence growth by 1%), but it will also reduce employment growth. New technologies create new jobs over the long term but can lead to fewer jobs over shorter time periods. It may take time for workers displaced by AI to retrain and find new jobs. There could be serious market weakness if the Fed stops cutting because of inflation at the same time that employment weakens due to AI displacement.
EU: Political risk in France holds back the euro

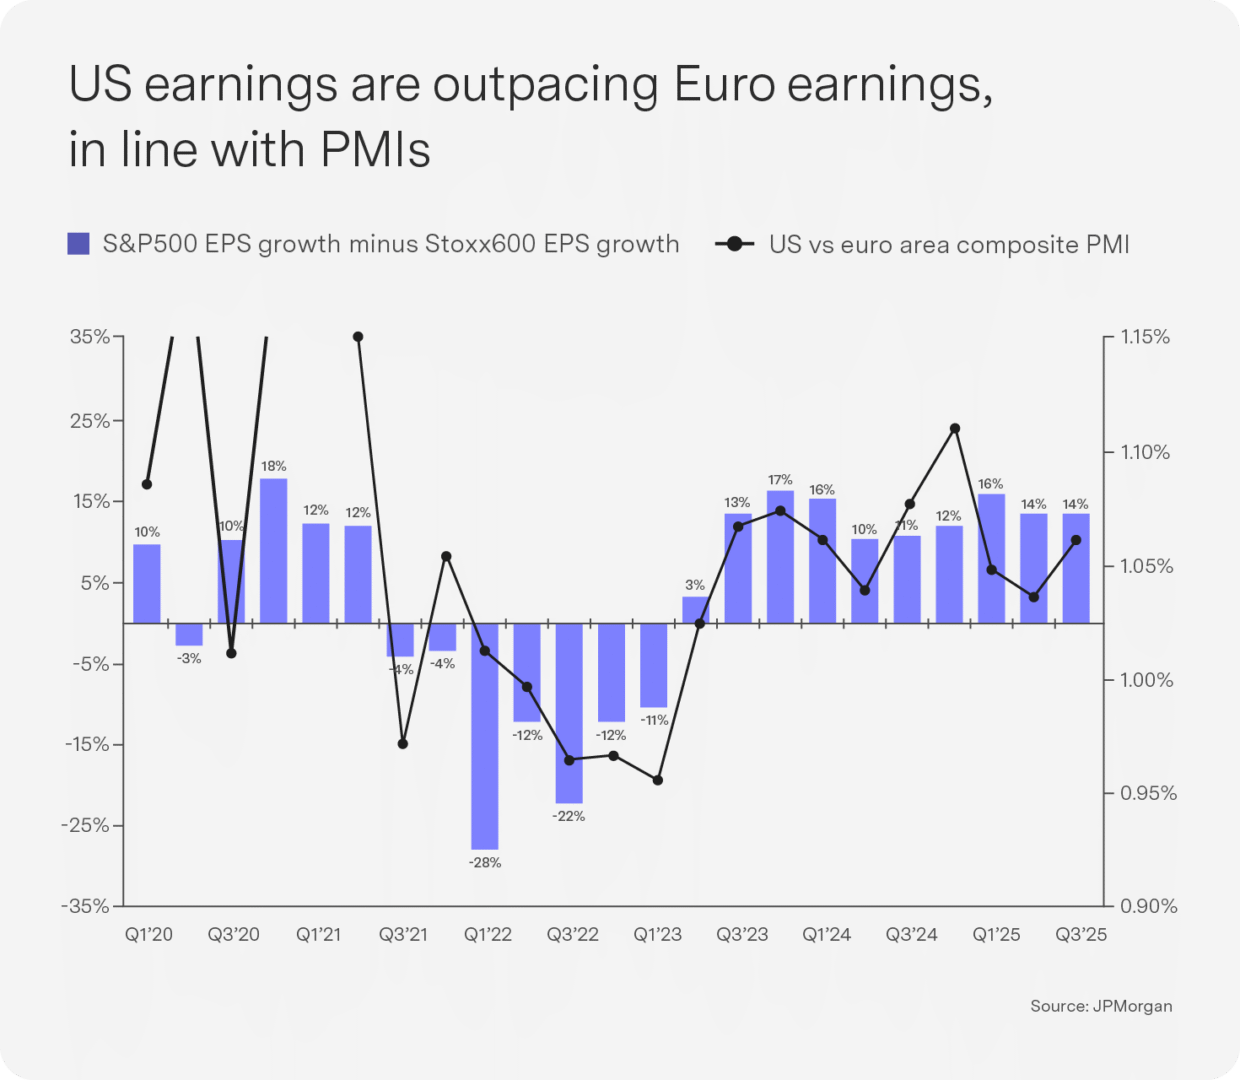
Despite policy uncertainty remaining high in the US, it continues to outperform the EU, with stronger earnings driven by strong productivity growth. US earnings have continued to outperform European companies in Q3, in line with stronger PMI surveys in the US versus the EU. US earnings are around 11% for the year, while eurozone earnings have fallen by 3% (see Chart). Earnings for the EU should pick up next year, but political headwinds remain.
Major ratings agencies have downgraded French sovereign debt, because France faces ongoing structural deficits caused by rigid social welfare programs and generous pension spending, which prevent the country from consistently meeting EU fiscal rules. Despite having had five Prime Ministers in the last two years, France’s 2026 budget lacks credible measures to reduce deficits, and political fragmentation is hampering the government’s ability to implement reforms. Contagion risk to other EU countries appears limited, but it will keep the euro under pressure.
China: Going from “uninvestable” to best in class
An ongoing war of words between Japan and China around Taiwan threatens to derail the Trump-Xi relationship. New Japanese Prime Minister Sanae Takaichi said earlier in November that a hypothetical Chinese attack on Taiwan could result in a military response from Tokyo. Beijing views the island as its own territory and has denounced Takaichi’s remarks, demanding a retraction.
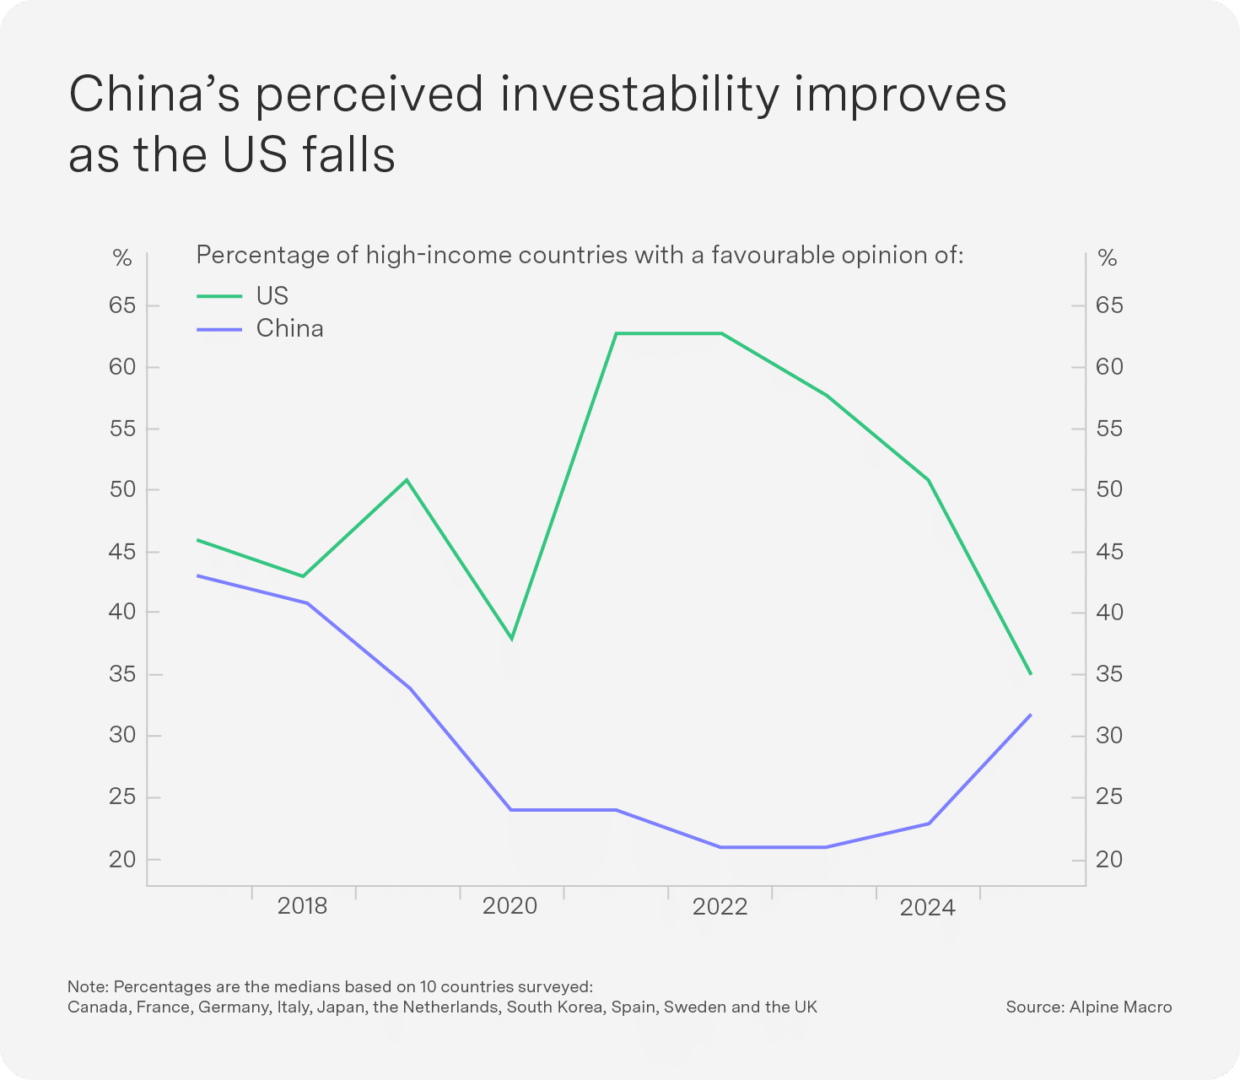
Surveys by the Pew Research Centre show improving views of China in most countries since last year (see Chart). Emerging markets generally view China positively, while the perceptions of developed nations have swung from very unfavourable to levels comparable to those of the US. This will help China attract foreign investment and create a wider international market for Chinese products.
Domestic Chinese investors are investing more in the Chinese stock market. Household bank deposits remain well above historical averages and with room to fall. Interest rates remain near historically low levels, providing households with strong incentives to switch into the market to seek higher returns. Liquidity still appears to be improving in the economy. M1 money supply accelerated in recent months, which is traditionally a leading indicator for Chinese business cycles. We remain positive on the outlook for China and emerging markets, while noting that short-term dollar strength could put pressure on these asset classes.
Outlook for 2026, growth will be impacted by AI readiness

Strong earnings growth, rate cuts, AI momentum, US deregulation, EU defence spend and accelerating PMIs into year-end across all major regions should continue to support the market, and we remain overweight equity. Though employment has slowed, US households had a windfall year, with wealth rising by over $12tn as the markets rose; the short-term risks of a recession are low.
A wide range of retail investor favourites (including Bitcoin, the ARK Innovation Fund and the Goldman Sachs Non-Profitable Technology Index) peaked in October and have been trending lower ever since, suggesting that investors are becoming more discerning. AI remains a key risk into 2026, as elevated AI capex plans could disappoint, AI investment may not be monetised and AI could weaken employment faster than expected. All of this is a recipe for increased volatility, as was the case in the Internet tech bubble of the late 1990s.
Geopolitical risks also remain high in 2026. The US’s latest peace plan for Ukraine requires Kyiv to limit the size of Ukrainian forces and withdraw troops from eastern Donetsk. Meanwhile, Japan and China’s fight over Taiwan has threatened to derail the Trump-Xi relationship.
Valuations remain expensive, but bubbles do not usually end with improved underlying fundamentals, easing monetary conditions and positive fiscal support; they are usually killed by raising rates. The biggest risk is thus US inflation: Will soft employment and productivity improvements keep unit labour costs close to the Fed’s target of 2% inflation, allowing more interest rate cuts and the equity bubble to grow? Or will tariffs and immigration restrictions boost inflation above the current 3% and limit the FOMC’s ability to ease monetary policy, constraining excess liquidity and causing more market sell-offs, as we saw in November?
We remain overweight EM equities and bonds. EMs are supported by Chinese stimulus, high commodity prices, an Association of Southeast Asian Nations (ASEAN) AI-led capex boom and monetary easing backed by disinflation.
We are neutral SA bonds, which are priced for perfection, but tactically overweight SA equities. Elevated levels of gold and platinum will support SA equities, with 36% of the MSCI SA Index being gold or platinum group metals. The new 3% CPI target, ostensibly stabilising debt/GDP and encouraging optimism on the government’s reform delivery, may lead to foreign inflows. However, this will ultimately depend on whether growth recovers in 2026, and gold could face headwinds from China’s addition of VAT to purchases, India’s slowing growth and a more stable dollar. We thus still prefer the diversification of broader EMs over South Africa.
Key indicators
