Sygnals Monthly Bulletin – August 2025
The Fed put and US fiscal dominance are driving investors into real assets

As we enter the third quarter of 2025, markets have continued to hit new highs despite rising geopolitical risks. Investors are confident that strong fiscal and monetary policy support will prevail, but market challenges remain significant.
Global tailwinds
- The Fed put and fiscal dominance: The Fed is mandated to balance inflation risks and employment growth – as inflation rises, it raises rates to slow growth (leading to the market adage, “Bull markets don’t die of old age, they are killed by the Federal Reserve”). The “Fed put” refers to the widespread belief that the US Federal Reserve (the Fed) will cut rates to support financial markets during periods of stress or sharp declines in growth. The Fed has not cut rates recently given potential tariff inflation, but markets expect the next Fed chair to cut rates aggressively under Trump’s influence – even amid tariff inflation. In addition, the proposed policy of issuing short-dated bills instead of debt blurs the lines between money and fiscal policy and raises concerns that government spending may outweigh the Fed’s inflation control efforts – known as fiscal dominance. This has supercharged the Fed put, undermined the value of cash and bonds and forced investors to switch into real assets protected from inflation, such as equities, commodities, precious metals and bitcoin.
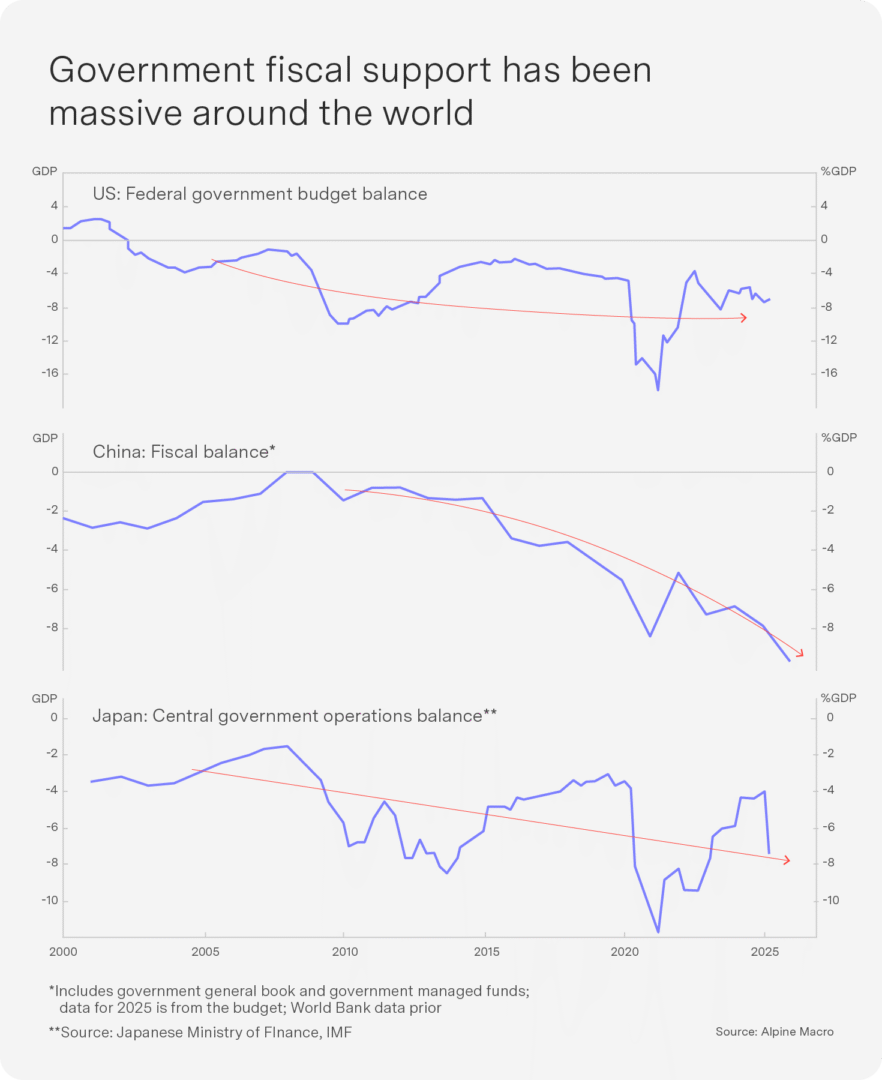
- Massive fiscal stimulus: In addition to potentially loose monetary policy in the US, the US’s “one big, beautiful bill” will result in expansionary fiscal policy, including investment incentives, and reinstate full expensing of select capital and research & development. The US joins China and Japan in deploying coordinated fiscal stimulus equal to 8–10% of GDP, supporting consumer and business confidence (see chart). The EU is increasing its fiscal stimulus via increased defence spend.
- US dollar weakness: The weaker dollar supports global growth by easing financial conditions, boosting commodity prices and lowering funding costs abroad.
Global headwinds
- Tariffs higher than expected, with greater impact: President Trump has met his 1 August tariff deadline and introduced sweeping new tariffs on dozens of US trading partners, ranging from 10 to 41 percent. Other completed deals have already been struck at levels above the initial 10% level – notably, a 15% tariff agreement with the EU – and some tariffs are not easily solved by trade, such as 50% tariffs on copper and Brazilian goods, a 100% secondary tariff on Russian goods and penalties on Chines trans-shipments and BRICS-aligned countries. Markets are also underestimating how much inflation tariffs will cause – copper futures surged 17% on the tariff announcement, their largest intraday spike since 1989. US June core inflation showed that core goods inflation excluding autos had jumped a massive 0.55%. According to JPM, the effective tariff rate in June was only 9.5% – compared to the statutory level of 14% – due to delayed enforcement, stockpiling and shifting trade routes. The statutory level is expected to rise to 22% on 1 August.
- Immigration reversal: The rollback of Biden-era immigration policies has removed legal-worker rights from 1.1 million jobs, which could reduce the US labour supply by about 0.8%, constraining growth and potentially pushing up wage inflation.
- Tariff frontloading: The early surge in exports to the US ahead of tariff implementations boosted H1 growth but will likely slow in the second half of 2025 as inventories normalise and trade volumes fall.
While the Fed’s asymmetrical intervention supports real assets, risks such as tariffs and immigration policy changes pose stronger growth headwinds than are currently priced in. We remain watchful for inflation developments.
Will the proposed new inflation-target band enhance growth?

While it is always difficult to predict policy proclamations and their timing, particularly from National Treasury, the South African Reserve Bank (SARB) seems likely to get its narrower inflation target band. The current inflation-target regime was introduced some 20 years ago when the late Tito Mboweni was SARB governor. The range was set at 3–6% then and has remained South Africa’s price anchor ever since. In 2003, Mboweni announced his intention to narrow the range to 3–5%, but rand and price volatility meant that then Minister of Finance Trevor Manuel held it at the more forgiving 3–6% range.
Some 20 years later, the SARB is again ramping up pressure for a narrower inflation-target range. This time, however, the range is appreciably stricter: proposing a point target estimate of 3%, the SARB governor noted that the current range is “now rather dated, reducing our competitiveness and opportunity” and hinders a of the currency. This proposal is not only lower than the current range midpoint but is much stricter in that it enforces a single price growth estimate for anchoring inflationary expectations. This would be much harder to achieve!
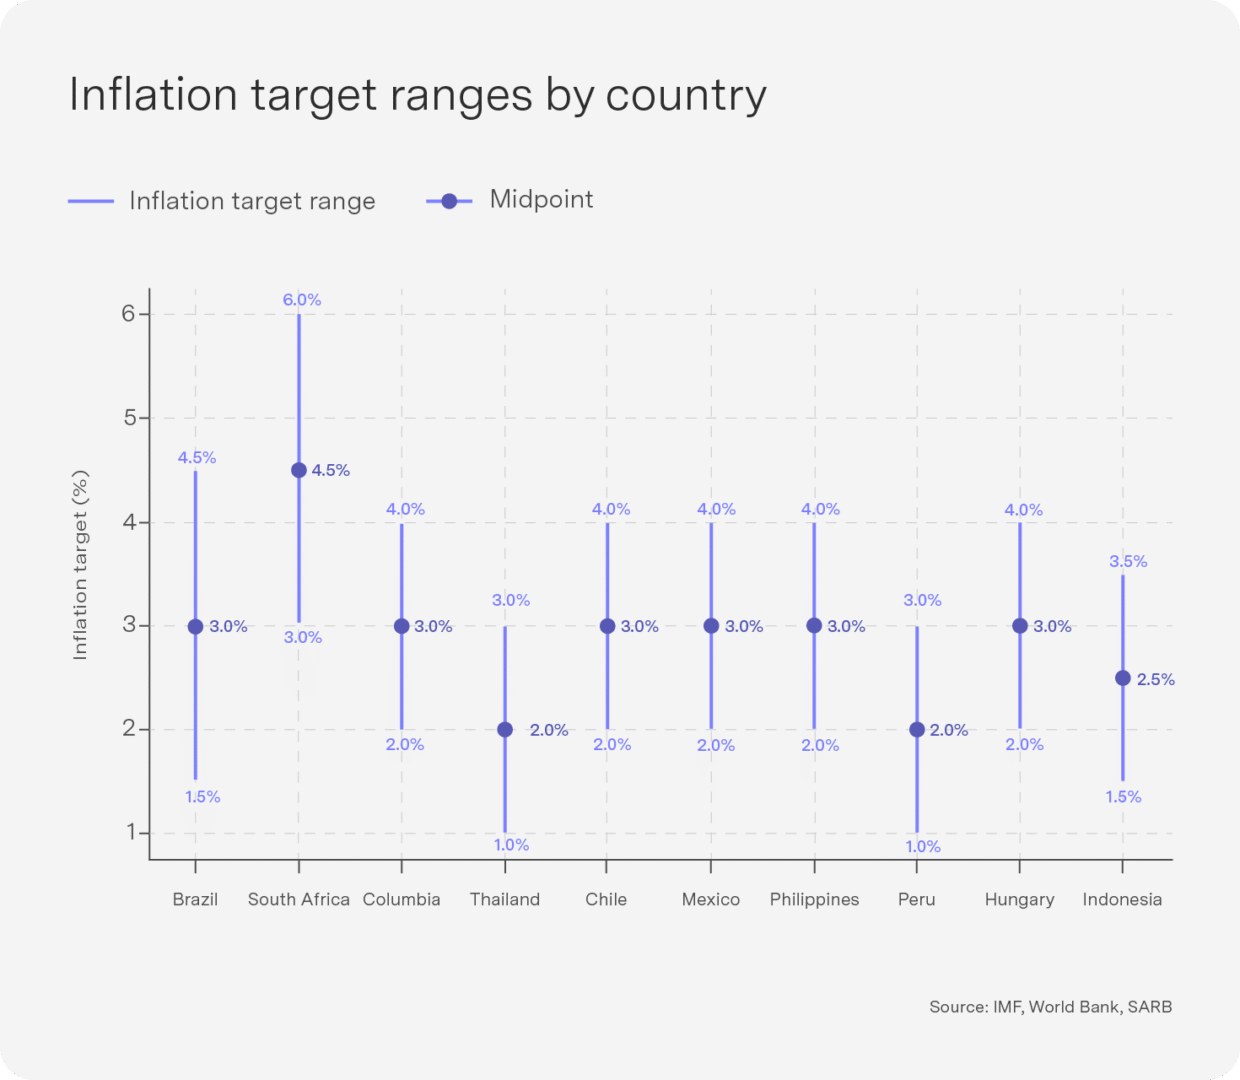
Part of the SARB’s reasoning is that we have drifted away from price discipline relative to other emerging markets. In the previous two-decade period of global low inflation, most emerging markets with inflation-targeting regimes reported narrower and lower ranges (see chart). Mexico’s range is now 2–4%, as is that of Chile, Colombia, Philippines and Hungary. Peru is much stricter, with a 1–3% range, while Brazil, despite having a range as wide as South Africa’s, is lower at 1.5–4.5%. The case for a lower range or point estimate is thus compelling purely on the basis of country comparisons.
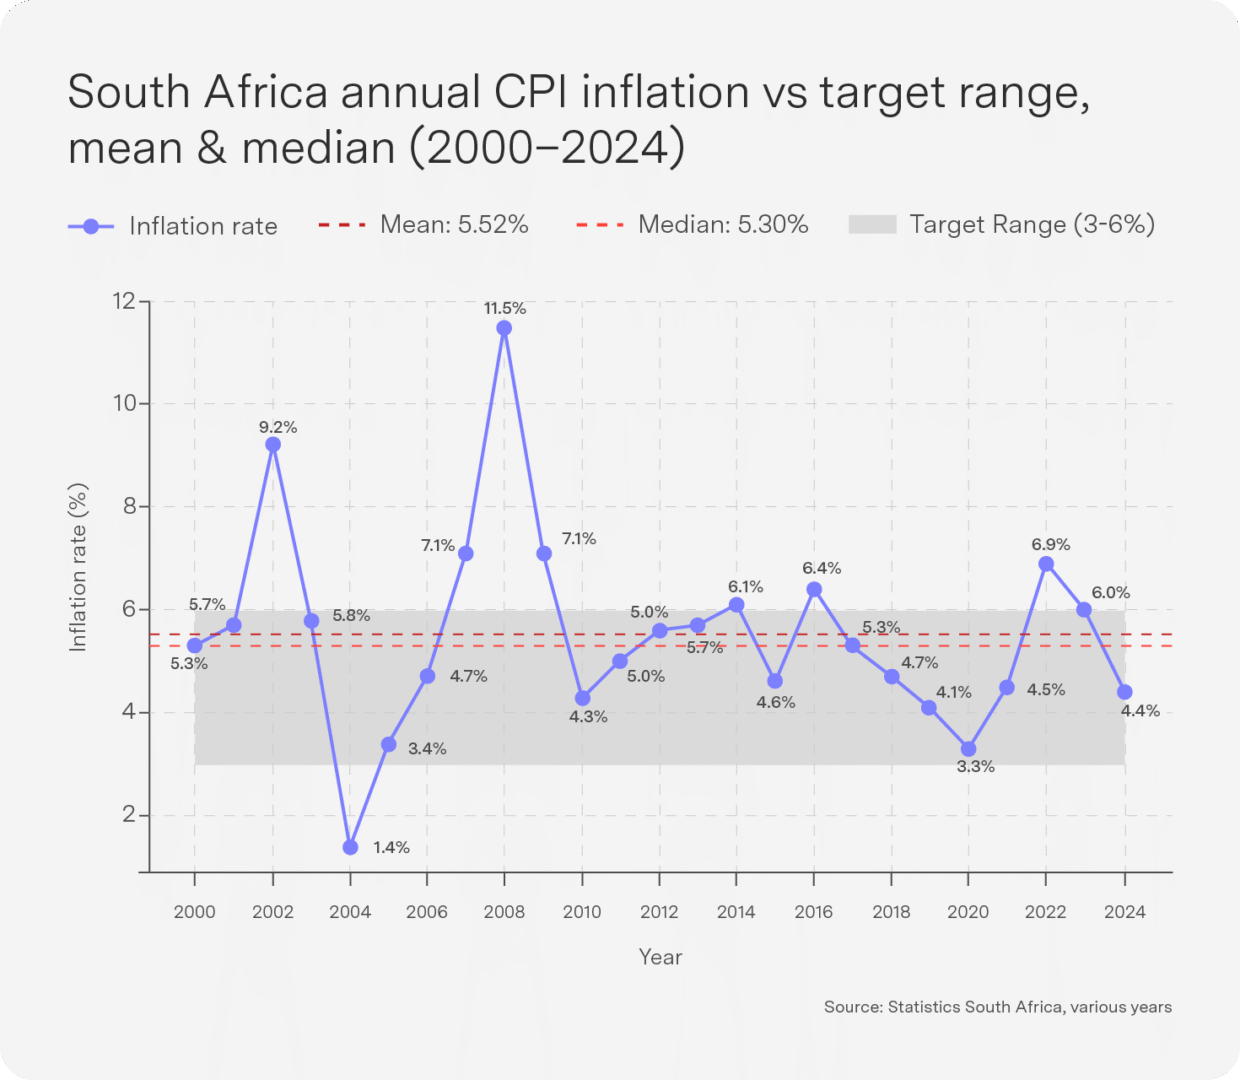
As the proposed target is stricter, we should consider how well we performed with the wider target. The evidence here is less persuasive than I expected! The data show that while, on average, we stayed within the range, our mean and median inflation rate over the 2000–2024 period were 5.5% and 5.3% respectively – just squeaking into the upper end of the range. However, these data do not capture the decline in price volatility in the post-2000 period, which caused the standard deviation of inflation over this period to drop significantly. This is key to an inflation-targeting regime, as it shows that households’ and firms’ expectations around inflation have become “anchored” around a narrower range. The 3% proposal is ultimately an attempt to shift economic actors’ expectations around prices down to this new, much lower level.
The most obvious explanation for this incessant push for a lower inflation target is that lower prices or less inflation are better for households and firms. Inflation intrinsically means that the price of goods and services increase unpredictably over time, causing poorer households to suffer, as their disposable income effectively declines over time across a range of goods and critical services. Likewise, firms with rising input costs are domestically and globally less competitive (through an appreciating currency) and may induce extreme cost-cutting measures that affect their growth prospects. So-called “menu costs” or indexed costs such as wage adjustments, annual service price increases (such as insurance premiums or retirement annuity contributions) all rise and accumulate over time as prices embed themselves in the economy. And so the spiral of higher prices and lower growth, reduced consumption and investment begins. Stable low inflation is regarded as one of the magic ingredients for an improved economic growth outlook – the SARB model, for example, shows GDP growth rising by 0.25% after five years and around 0.4% after a decade with a 3% target. Likewise, consumption and investment growth are projected to increase by between 0.5 and 0.67 percentage points after a decade.
However, a lower inflation rate offers significant fiscal advantages – particularly compelling given South Africa’s current high levels of debt-to-GDP ratios and exorbitant debt servicing costs. Lenders (mainly domestic banks) demand a real return plus compensation for expected inflation: if inflation expectations fall, the nominal interest rate on new bonds and roll-overs also falls, and government would thus pay less on its current and outstanding debt. A lower inflation risk premium is also built into long-dated bond premiums (although country risk and fiscal risk may remain). Furthermore, should these lower debt servicing costs be coupled with higher GDP growth, the pressure on the fiscus will be reduced as growth exceeds debt servicing costs. These results are consistent with the SARB model and are highly compelling.
Given all these advantages, why have we not moved sooner to the 3% target? Firstly, there are significant negative short-term costs to be aware of: the SARB itself models a reduction in GDP growth of 0.3 percentage points. Coupled with looming tariff threats from the USA, our already anaemic growth rates could halve in the short term. Lower growth would bring with it an elevation of all the fiscal constraints the government already faces – from rising fiscal deficits (as revenue dries up), a worsening debt-to-GDP profile to concomitant negative effects on long-term bond yields. So the transition costs are not insignificant and could last longer than the one year modelled by the SARB; it is also not a sure bet that policymakers and politicians will support the short term socioeconomic costs.
Assuming the 3% target would be phased in over a few years, the greatest risk may be over the medium term from fiscal policy demands, price setters in the economy and the target itself. In attempting to maintain its fiscal commitments, government may simply ignore the 3% commitment (or kick it down the road a few years) to maintain fiscal spending.
Wage demands may also not willingly bend to the 3% target as unions pressure for now-standard above-5% increases. In such a scenario, fiscal and monetary policy credibility could be at serious risk and the 3% target in danger of not being achieved.
Perhaps the SARB should be more modest in its price-fighting goal; if we were not able to narrow the range during the most stable macroenvironment, under President Mbeki, what are our chances now? One option is for the SARB to consider a narrower range of 2–4% or even a more accommodating 1.5–4.5% (a la Brazil). Losing domestic and global credibility in both fiscal and monetary policy could be worse than not narrowing the interest target band.
Top-performing Sygnia funds

Emerging markets and tech once again dominated the top five on the back of the weaker dollar, stronger commodity prices and record-beating results from the likes of Microsoft and Alphabet (Google). China, broad EMs, SA property, global equity and the 4th Industrial Revolution Fund are all in the top five for the month. The 4th Industrial Revolution Fund is a thematic fund that invests in global companies optimally positioned to benefit from new technologies and innovations across a broad range of sectors.
1-month absolute performance as at 31 July
- Sygnia Itrix MSCI China Feeder ETF 6.6%
- Sygnia 4th Industrial Revolution Global Equity Fund 5.4%
- Sygnia Itrix MSCI Emerging Markets 50 ETF 4.9%
- Sygnia Listed Property Index Fund 4.8%
- Sygnia Skeleton International Equity Fund of Funds 4.2%
The FANG fund has climbed to the top position over the past 12 months, with emerging markets breaking into the top five at number four. Both FANG funds remain in the top five as AI continues to propel valuations (Microsoft is now a $4 trillion company), while South African property holds the final spot on the back of another rate cut from the SA Reserve Bank.
12-month absolute performance as at 31 July
- Sygnia FANG.AI Equity Fund 37.5%
- Sygnia Itrix MSCI China Feeder ETF 36.5%
- Sygnia Itrix FANG.AI Actively Managed ETF 34.0%
- Sygnia Itrix MSCI Emerging Markets 50 ETF 24.7%
- Sygnia Listed Property Index Fund 24.3%
US dollar doldrums: A weaker dollar despite a resilient US economy
Exceptional US productivity growth, AI leadership, strong fiscal support, strong corporate investment and strong foreign capital inflows are driving a resilient economy, but structural and cyclical pressures are weighing increasingly on the greenback.
Structural headwinds to dollar strength
- Overvalued dollar: The US dollar remains expensive on a purchasing power parity basis, raising the likelihood of a longer term mean-reversion trend.
- De-dollarisation: Major emerging markets and some US allies are gradually settling energy and commodity trades in non-dollar currencies, investing in digital payment infrastructure and diversifying their reserve holdings. While de-dollarisation will remain a slow-moving trend, it is steadily eroding the dollar’s status as the dominant global reserve currency – a process underway for over a decade.
- Fed policy, dollar policy and fiscal dominance: The political tone in Washington has signalled a notable change in dollar policy. Firstly, President Trump has hinted at replacing Fed Chair Jerome Powell with a more dovish candidate, reinforcing expectations of policy rate cuts sooner than warranted by inflation alone. The leading candidates are Kevin Hassett and Kevin Warsh, both of whom have recently adopted more dovish positions. Secondly, Treasury Secretary Scott Bessent has clarified that a “strong dollar” policy no longer means a strong exchange rate but is meant as continued demand for the dollar as a reserve asset. Thirdly, the administration has stated that it favours issuing more treasury bills instead of bonds – an approach that injects liquidity into the economy by reducing repo haircuts, contributes to a steeper yield curve and higher inflation expectations and ultimately to a softer dollar, as it raises perceptions of fiscal dominance.
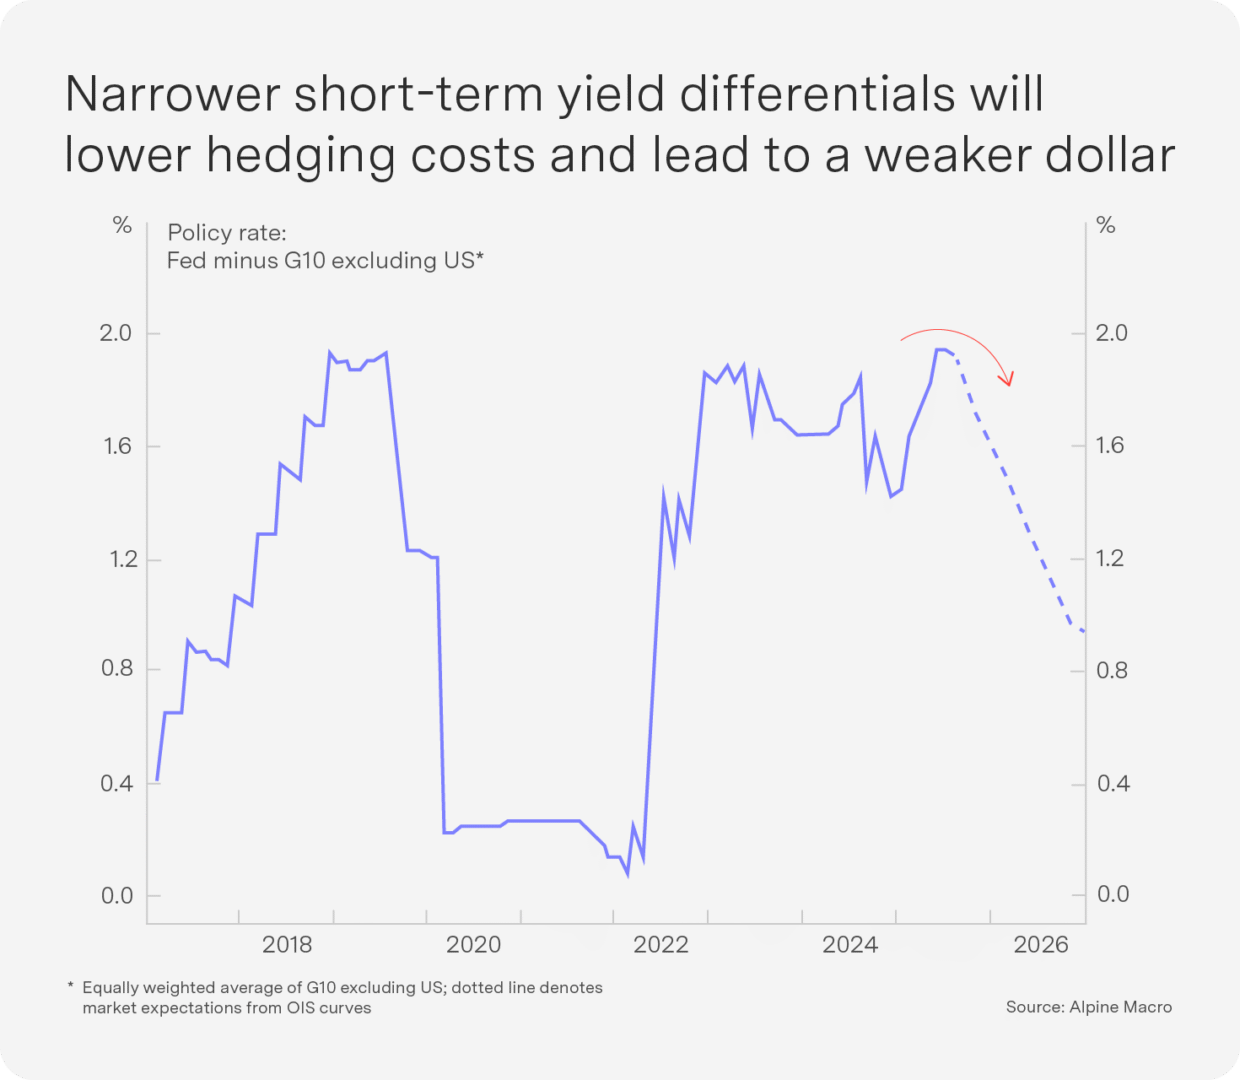
- The hedge ratio reversal: According to BIS, foreign investors – especially in Asia and Europe – did not hedge their US investments between 2014 and 2021. This year, however, the weakening dollar triggered a negative feedback loop: as foreign investors experienced foreign exchange losses, they were forced to increase dollar hedge ratios. As short-term US interest rates fall and the yield curve steepens, the cost of hedging will decrease, making it more attractive – and thus weakening the dollar.
Short-term outlook: A bounce is likely
The dollar is currently oversold on technical indicators. Positioning is extreme, with speculators building significant net short positions. Hedge costs will remain high until the Fed starts to cut, suggesting that while the medium-term trend is down, we may see some consolidation or bounce in the near term.
China: Further support on the way

China’s economy grew by a stronger-than-expected 5.2% year-on year in the second quarter of 2025. Export performance remains robust, and the industrial sector continues to show resilience. However, the consumer sector is still soft and the property downturn has persisted. As front-loaded shipments fade, export momentum may also slow in the second half of the year.
One bright spot is the global copper market: despite copper-intensive EV demand slowing, the US is projected to add over 1 million metric tons of copper demand annually by 2030, more than twice the refined-copper deficit in 2024 – largely driven by the rapid buildout of AI-focussed data centres. While this demand has supported the copper price this year, it did fall 20% at the end of the month after President Trump excluded copper from US import tariffs, underscoring the market’s sensitivity to tariff headlines. However, the US accounts for just 6% of global copper demand, compared to China’s 60%, which should limit the global impact of US trade policy.
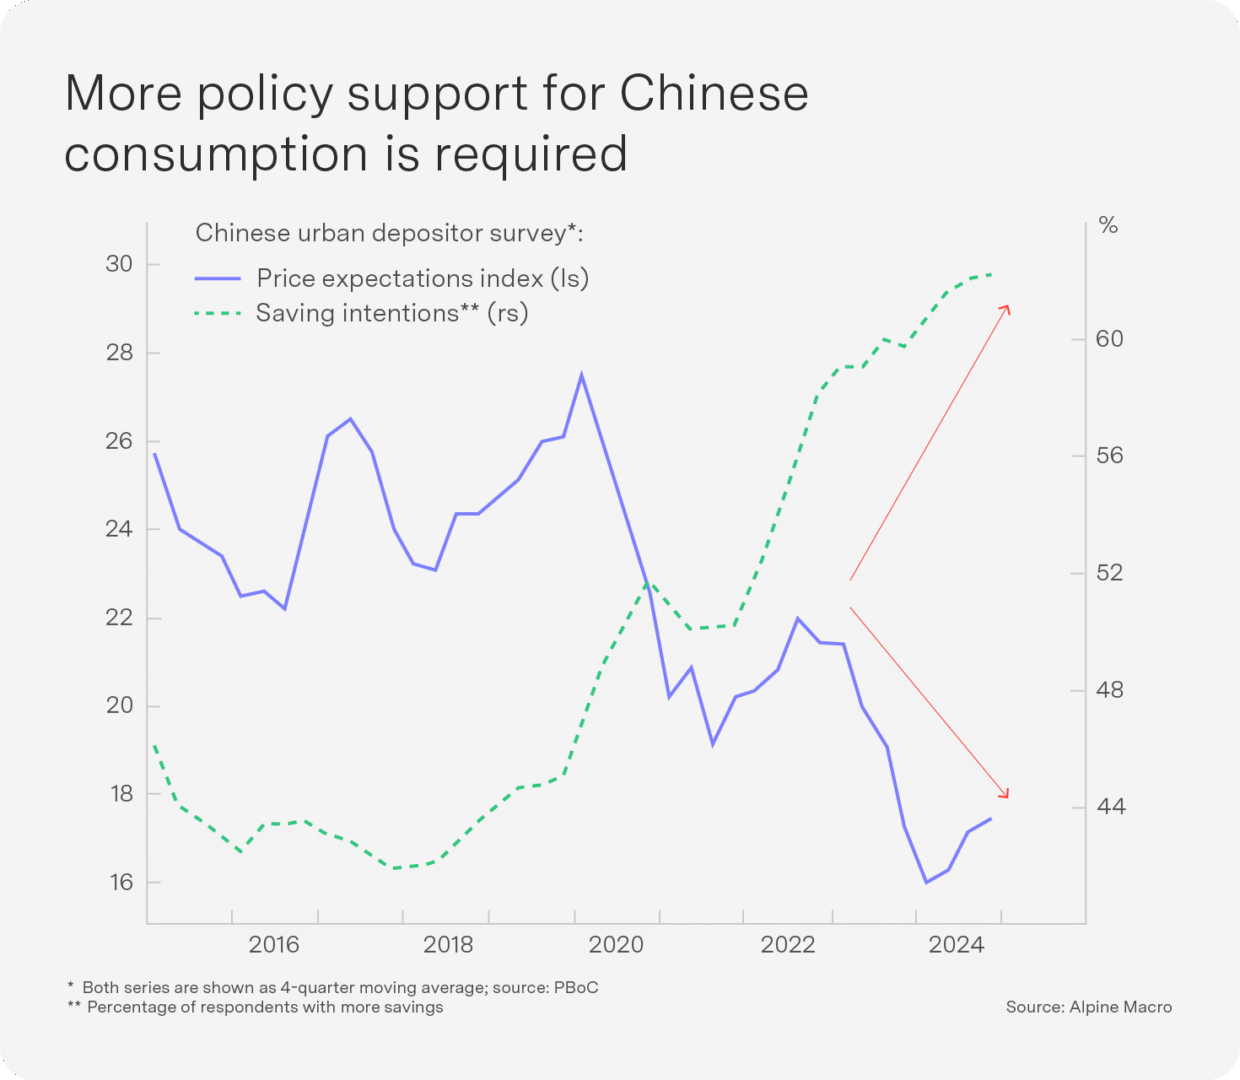
Despite strong real growth, deflation remains a major headwind. Headline inflation has hovered near zero for four years, while producer prices have continued to contract, marking the longest deflationary stretch in China’s post-reform era. Consumer sentiment remains cautious, with household savings intentions at a decade high. In response, the Central Financial and Economic Affairs Commission – chaired by President Xi Jinping – called for the regulation of “disorderly low-price competition”. Stimulating domestic consumption is now essential to sustaining growth, and more targeted policy support is expected.
Outlook: Government support outweighs political risks

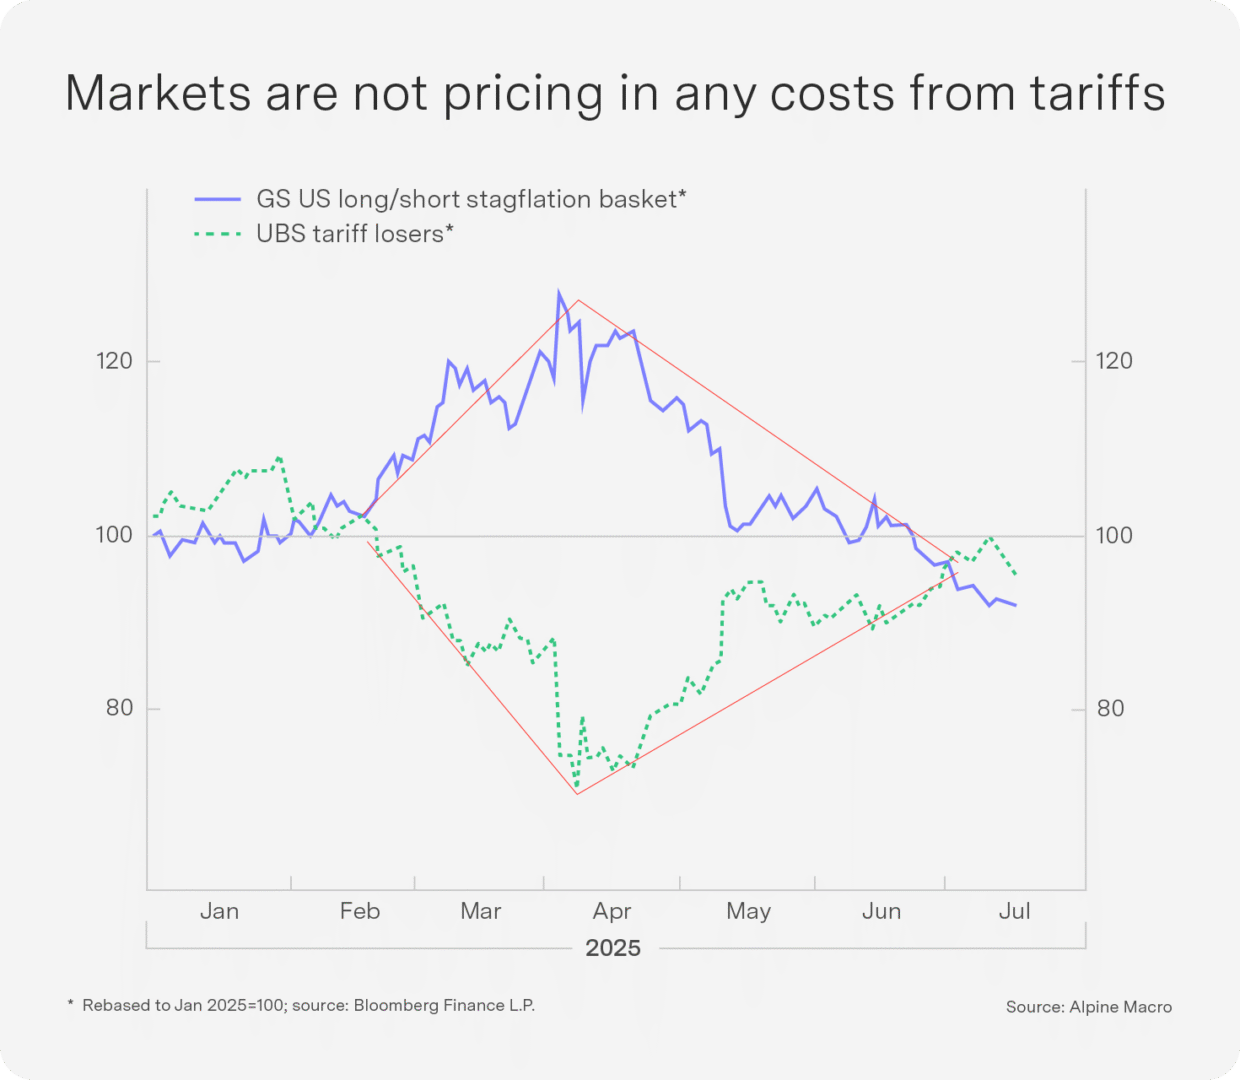
Trade volumes are falling in the second half of 2025, US immigration policies have tightened and economic uncertainty is rising. Company earnings remain well below their mid-2024 peaks, and ISM surveys indicate a challenging combination of higher inflation and lower employment. Markets do not seem to have priced in any costs of tariffs despite these pressures (see chart). This is surprising, as two-year inflation swaps have risen above 3%, a warning that inflation expectations may have become unanchored. This would be a big concern for a Fed that was not being pressured from the top.
Driven by the Fed put, however, investors appear more focused on inflation risks than slowing growth.
The combination of expansive fiscal stimulus and expectations of looser monetary policy supports risk assets. As a result, investors are fleeing the dollar, cash and bonds on fears that rising inflation will erode money’s value. This shift in investor sentiment has pressured the dollar lower and benefitted the euro and emerging market currencies. Consequently, there is strong demand for real assets such as gold, bitcoin and equities, which has driven these asset prices higher. We continue to favour emerging markets and remain overweight real assets, while maintaining a cautious stance that is dependent on upcoming tariff policy decisions.
We are not fighting the Fed for now, but we are watching for two key risks: tight immigration policies that could slow US growth and an inflation spike that could shake up asset prices later this year.
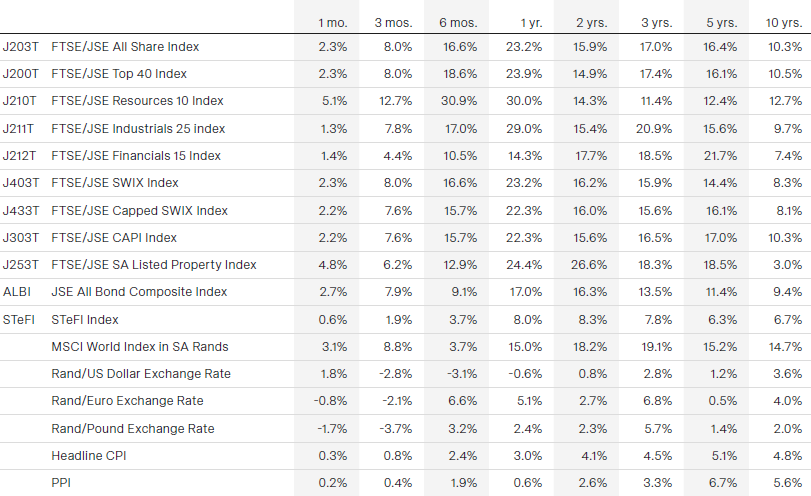
Key indicators