US inflation set to rise as tariffs increase the burden on consumers
Markets reached new highs in August, bolstered by easing tensions as US President Trump reduced pressure on Russian President Putin. Significant headwinds are approaching the US consumer, however, driven primarily by rising inflation linked to tariffs. US companies have absorbed most of the costs from Trump’s tariffs until now, but this burden is increasingly being shifted to consumers, which is expected to push inflation higher. Goldman Sachs forecasts that the Fed’s preferred inflation gauge, core personal consumption expenditures (PCE), will rise to 3.2% by December 2025 on tariff-related cost pressures.
The impact of tariffs is tangible and measurable: customs collections surged to $27 billion in June – four times the 2024 monthly average – confirming that tariffs are being paid without significant avoidance or reduction in import volumes. US firms have absorbed approximately 64% of the tariff costs thus far by managing inventories, but this is expected to drop sharply to 8% as companies pass costs directly to customers. This expectation is supported by corporate earnings guidance that reflects improved margins and by the July US producer price index (PPI), which jumped 0.9%, marking its largest monthly increase since June 2022. The primary services component of the PPI – a proxy for US corporate profit margins – remains elevated, suggesting tariffs will likely be reflected in higher consumer prices, sustaining headline inflation.
Foreign exporters have absorbed little of the tariff costs to date, with steady import prices reflecting no significant discounts. While exporters may take on a slightly larger share (rising from 14% to 25% according to Goldman Sachs) if import volumes decline sharply, the brunt will fall on US consumers, who absorbed only 22% of tariff costs through June but are expected to see their share surge to 67% by October as companies transfer the burden downstream.
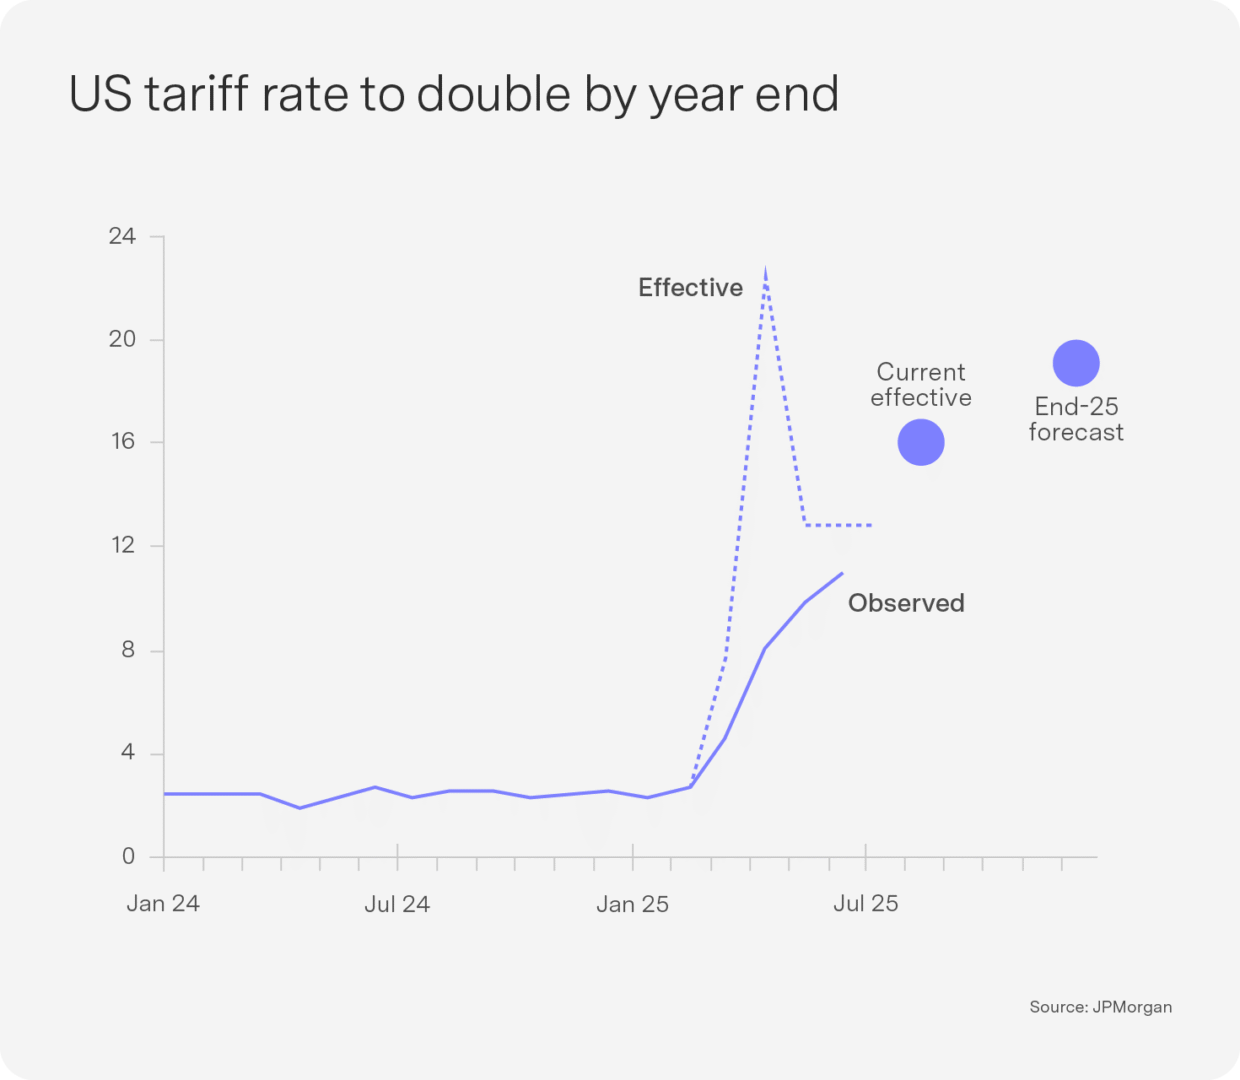
JP Morgan estimates that core measures of underlying inflation remain elevated at around 3% or higher, and the effective tariff rate is projected to nearly double to 20% by year-end, magnifying the tariff impact on consumers sixfold. This increasing pass-through of costs to consumers suggests inflation may rise beyond current market expectations.
The resulting inflationary pressures could unsettle markets in the near term and may dampen consumer spending over the longer term.
All that glitters is gold – for at least two decades now!

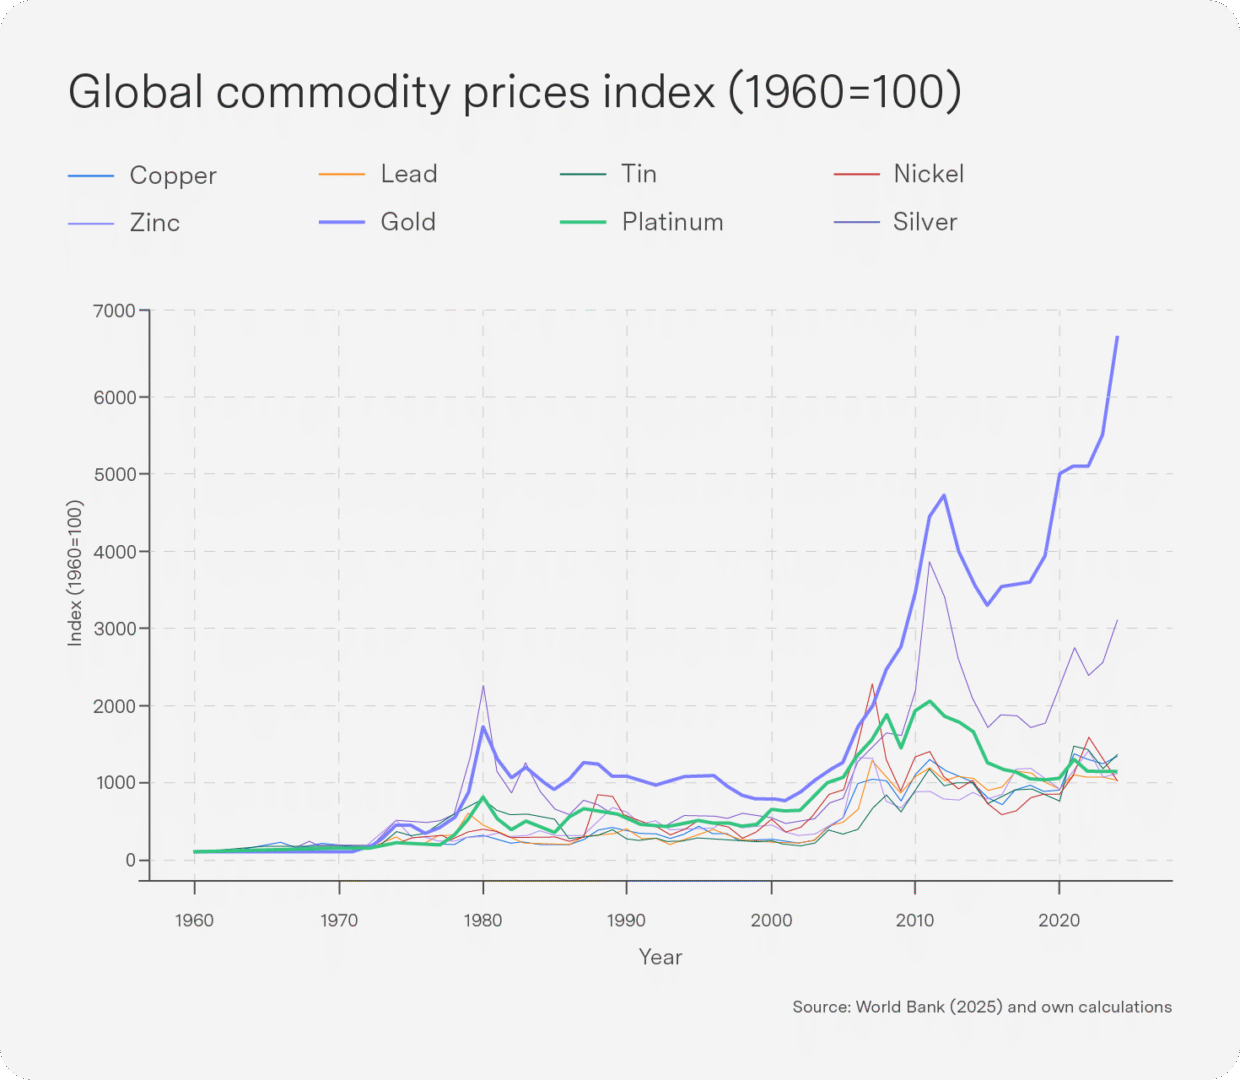
It has been an incredible two decades for the gold price. Hovering in the nominal range of about US$35 per troy ounce (the standard international benchmark, about 31 grams) in the 1960s, the metal has surged in recent years. Prices broke through the $300 barrier in the 1980s, ranging between $300 and $900, and consistently exceeded $1000/t oz over the last two decades, now fetching an eye-watering $3 392/t oz. The chart below shows this is not simply a “commodity cycle” effect or short-term spike. Other metals (platinum, silver, copper) have also gained, but their long-term trajectories have lacked the magnitude and persistence of gold’s rise. Platinum, for instance, spiked in the mid-2000s before retreating, even as gold maintained its upward trend. The 2000s have definitely been different for gold: a z-score distribution since the 1960s shows the gold price has returned extremely positive deviations from the long-term mean, particularly over the last five years.
For example, the 2024 gold price is the largest z-score since modern records began. In technical terms however, these are not short-term fluctuations in my view: I would argue that they indicate a persistent, statistically significant regime shift in gold price levels. Gold has always been a hedge and store of value, but more complex recent dynamics suggest the persistence of at least three core factors.
Firstly, global demand for jewellery has been increasing steadily in recent years, a function of the rise of the middle class in India and China. Data show that India and China together account for over half of global jewellery consumption, and both are at the core of this incremental increase over the past decade. The World Gold Council’s (WGC’s) 2025 mid-year report shows that India’s jewellery demand rose to 562 tonnes in 2024, up 14% year-on-year, supported by post-pandemic income recovery and cultural drivers like weddings and festivals, where gold remains popular as both adornment and a store of wealth. India’s middle class, estimated at 432 million people in 2022 and projected to reach 715 million by 2031, has driven these higher per-capita gold purchases, aided by financial inclusion and rural income growth.
Secondly, standard macroeconomic dynamics have most recently influenced gold’s price movements. Gold’s correlation with the US dollar is historically about -0.4, so the weaker dollar has directly supported higher gold prices. Simultaneously, low or negative real yields in developed markets have reduced the opportunity cost of holding non-yielding assets like gold, prompting institutional reallocations away from equities into “hard” assets. You don’t mind holding gold when the real returns on other safe assets like US treasuries are also very low.
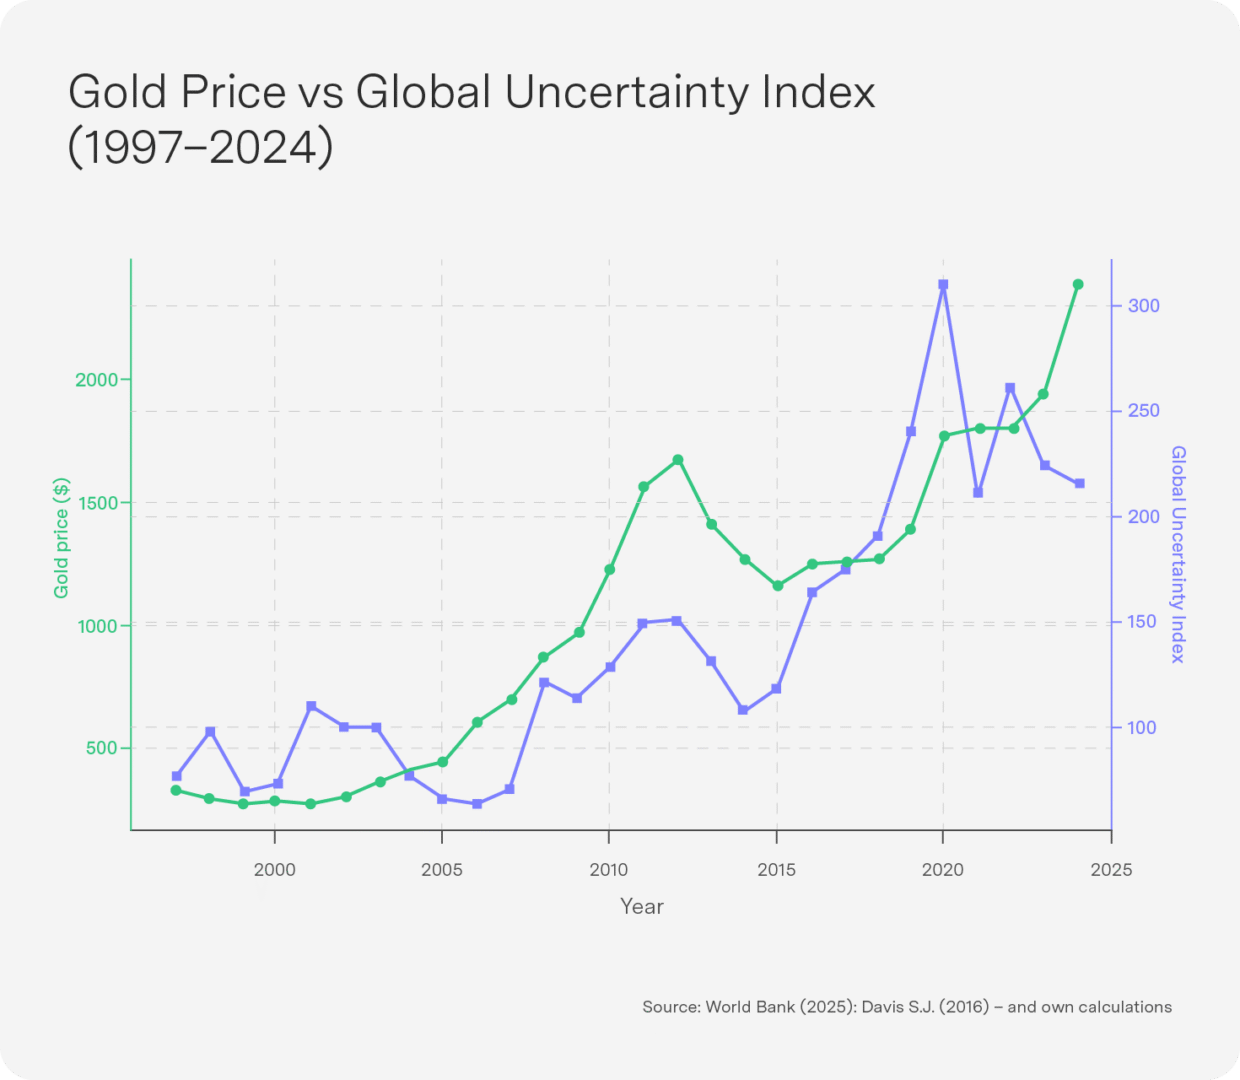
But these factors seem at best secondary in explaining the last five years of gold’s dominance. The final but most important driver has been the rise in uncertainty in the global economy. A quick look at the gold price and the widely used Global Economic Policy Uncertainty Index (produced by researchers from Stanford and Chicago) shows that rising uncertainty explains 82% of the movement in the gold price – albeit on the basis only of this simple bivariate relationship. The academic literature shows that gold acts as a safe haven, particularly in periods of financial stress. Over the last five years, geopolitical shocks (pandemic aftermath, Russia–Ukraine conflict, US–China trade tensions, climate risks) have kept risk aversion elevated, fuelling investor flight into the refuge of gold. While this demand will reflect in rising equity prices for gold stocks, much of the growth is also from official demand for gold from central banks around the world. Data show that central banks purchased over 1 037 tonnes of gold in 2023, the highest annual total since records began in 1950 (according to the WGC). This trend has continued into 2024–2025, with net buying exceeding 800 tonnes last year and a further 410 tonnes purchased in the first half of 2025. Commentators have argued that this spike in demand from central banks is not just about asset diversification but is also due to “geopolitical realignment”. Specifically, a number of “non-aligned” or “sanction-vulnerable” nations accelerated their gold accumulation following Russia’s invasion of Ukraine in 2022, when roughly USD300 billion in Russian forex reserves was frozen. These nations included Turkey, Kazakhstan, Uzbekistan and China, whose central banks sought to reduce their exposure to US dollar assets that could be blocked or devalued in a sanctions scenario. In practical terms, this bank buying has been price-insensitive: purchases occurred even at record gold price highs. International Monetary Fund and Bank for International Settlements data confirm this reserve-composition shift to gold in several emerging market central banks, with gold’s share of total reserves in these countries rising from 10–12% in 2018 to over 16% by 2024.
This new inflection point in gold, reaching levels well in excess of $1 000 /t oz has established a higher floor for the gold price, while Indian and Chinese demand and global economic policy uncertainty and geopolitical realignment are probably here to stay for some time. This suggests that the recent surge is not merely speculative, and though episodic corrections can and will occur once macro volatility (in particular) subsides – we have arguably entered a new phase in terms of the significantly higher range within which the gold price will continue to operate.
Top-performing Sygnia funds

South African-focused funds dominated the top 5 for the month of August as South African stocks continued to rally on the back of the rallies in Chinese technology companies and commodities, particularly precious metals. Japan moved into number one place after economic growth surprised to the upside, and Berkshire Hathway has made a nice comeback after a period of underperformance since CEO Warren Buffet announced his resignation.
1-month absolute performance as at 28 August 2025
- Sygnia Itrix MSCI Japan ETF 5.0%
- Sygnia Itrix Top 40 ETF 3.9%
- Sygnia Top 40 Index Fund 3.6%
- Sygnia Life Berkshire Hathaway Portfolio 3.5%
- Sygnia Listed Property Index Fund 3.5%
The funds are mostly stable over 12 months, with US tech, Chinese large caps and South African equities all doing well on the tech and commodity rally.
12-month absolute performance as at 28 August 2025
- Sygnia Itrix MSCI China Feeder ETF 43.4%
- Sygnia Itrix FANG.AI Actively Managed ETF 36.0%
- Sygnia FANG.AI Equity Fund 36.0%
- Sygnia Itrix Top 40 ETF 27.1%
- Sygnia Top 40 Index Fund 26.7%
US employment update, slowing growth but no recession in sight, Fed poised for September rate cut

The 1 August employment report showed the largest downward revision in over 40 years. As a result of these revisions, Trump fired Dr Erika McEntarfer as Commissioner of the Bureau of Labor Statistics (BLS) and nominated EJ Antoni in her stead. JPMorgan suggests the magnitude of the revisions is in line with norms over the past three decades. Antoni made headlines by suggesting the BLS should temporarily halt its monthly job reports “until it is corrected”, but he later backtracked his statement.
Markets were nonetheless rattled and the dollar weakened, as US and global interest rate market responses to the monthly jobs data are on average greater than for consumer price index (CPI) numbers or even Federal Open Market Committee (FOMC) rate decisions. Before the dollar had even recovered from Antoni’s statement, it took another hit when Trump said he was firing Lisa Cook from her position on the Fed’s Board of Governors. Trump would effectively secure a four-person majority in the seven-member Board of Governors if Cook goes quietly, but she has vowed to challenge Trump’s surprise decision. This will nonetheless add to global concerns about the Fed’s independence.
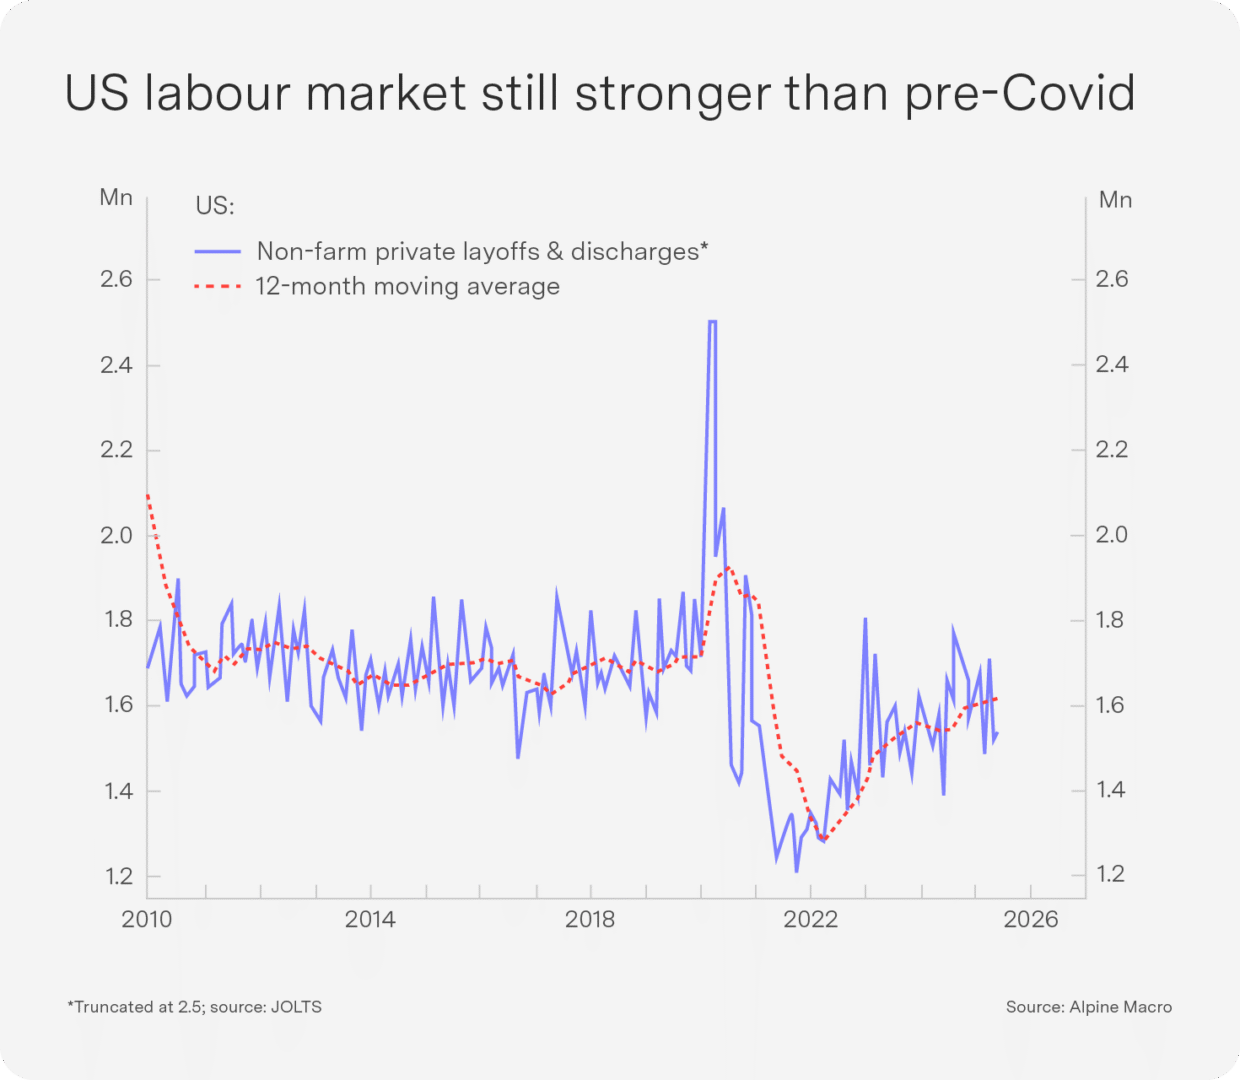
The recent slowdown in private payroll growth – dipping below 1% annualised over the past three months – prompted concerns about an impending recession, but broader labour market data offer reassurance:
- Labour income remains robust, supported by steady hourly wages and weekly hours worked.
- Claims and layoffs indicate no significant stress, with unemployment insurance claims stable and corporate layoffs at historic lows. The JOLTS data show layoffs and discharges well below pre-pandemic norms (see chart).
- Reduced immigration has tightened labour supply, easing the pressure for rapid employment growth relative to prior periods.
Taken together, these factors suggest a modest cooling of economic activity rather than a looming recession. Against this backdrop, the Fed appears likely to deliver a cautious 25 basis point rate cut in September as a pre-emptive measure to sustain growth. Whether driven by the employment revisions or political pressure, Powell was far more dovish than expected at Jackson Hole, stating “A reasonable base case is that the [tariff] effects will be relatively short-lived – a one-time shift in the price level” and that “The shifting balance of risks may warrant adjusting our policy stance.”
EU growth set to slow, EUR may weaken amid more ECB cuts, no peace dividend yet

The eurozone economy faces mounting headwinds:
- Rising US trade barriers on Chinese imports and a weaker Chinese yuan are likely to boost Chinese exports at the expense of EU exporters. This competitive pressure adds to the challenge of slowing growth in the region.
- Import prices for core consumer goods, which make up roughly 25% of the euro area’s inflation basket, are expected to decline further over the coming months, pushing the region closer to deflation.
- The European Central Bank’s (ECB’s) wage growth projections have plunged, signalling weakening labour market dynamics.
- Compounding these challenges, euro area banks have recently tightened lending standards, a move likely to temper consumption growth.
- German fiscal support, which could provide some stimulus, remains a long way off; implementation is expected to take at least 12 months, as allocations must pass through complex governance arrangements, off-budget vehicles and parliamentary approvals before funds can be disbursed.
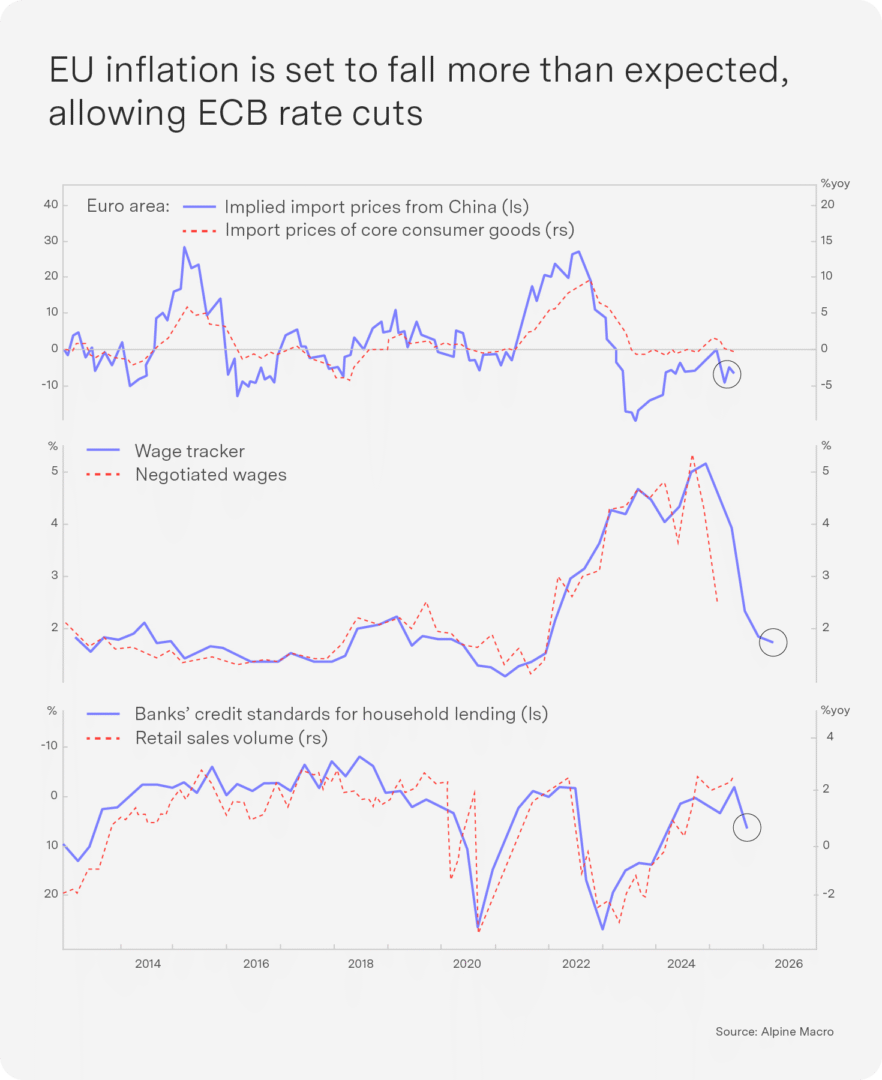
Against this backdrop, the euro may weaken further as additional ECB rate cuts loom.
On the geopolitical front, there was some progress in July in the Russia-Ukraine peace process. Putin has demanded Ukraine surrender the Donbas region as part of any agreement to freeze the conflict along current frontlines and insists that NATO be barred from deploying troops in Ukraine. While Trump has offered a security guarantee to Ukraine, the restriction on NATO troop deployment limits the US’ protection. Ukrainian President Volodymyr Zelenskyy faces a difficult decision regarding the fortified western sections of Donbas. Betting markets currently assign just under a 24% probability that a ceasefire agreement will be signed this year. We remain cautious given the absence of a clear peace dividend and the ongoing economic slowdown in the region in the short term.
China: US trade relations improving and stimulus showing signs of success

Trade relations between the US and China are showing signs of improvement. Trump has paused secondary tariffs on Russian oil exports to China, easing some economic pressure on Moscow. He also signed an executive order extending the current tariff truce with China by another 90 days, moving the expiration date to 10 November 2025. This extension paves the way for a potential Trump-Xi summit later this year, signalling a willingness on both sides to engage in constructive dialogue.
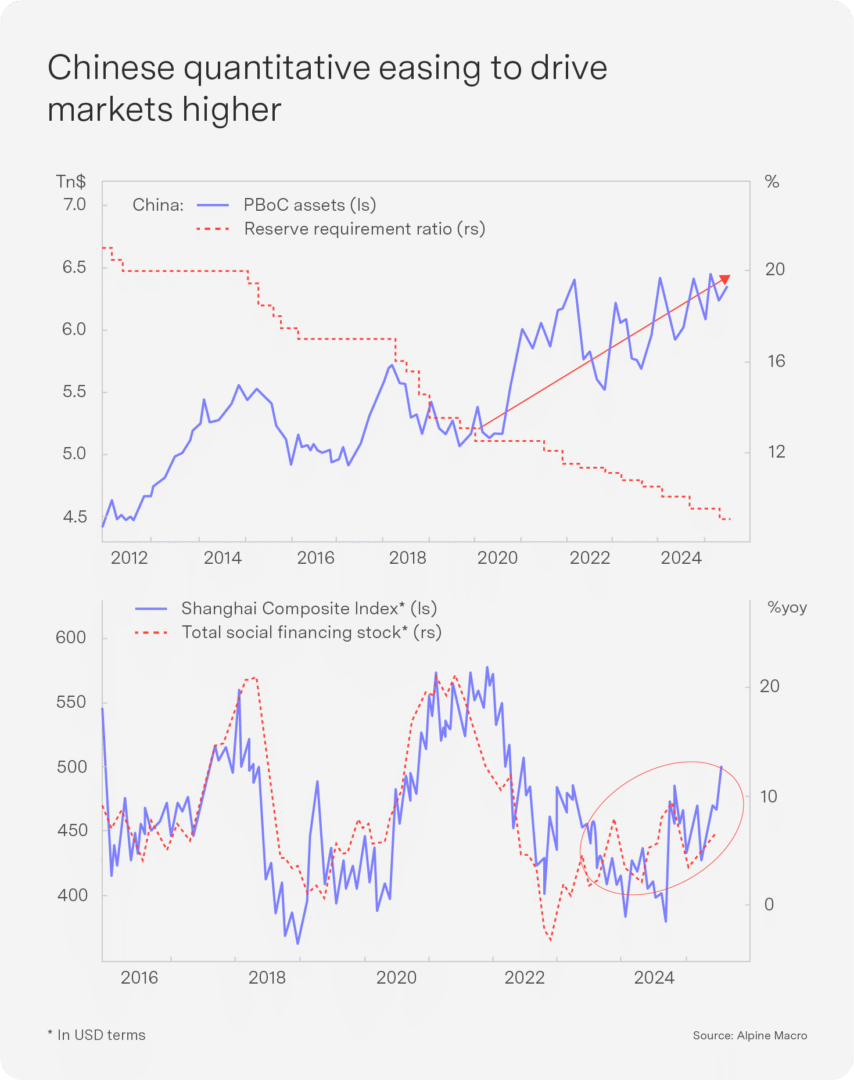
- China continues to actively stimulate its economy through a range of measures:
- Policy actions resembling a form of stealth quantitative easing, including cuts to the reserve requirement ratio, interest rate reductions and additional liquidity injections. Notably, total social financing has stopped contracting, providing upward momentum to equity markets.
- Broad fiscal spending expanded at its fastest pace in nearly three years, driving the fiscal deficit to a new high as the government navigates headwinds from weakening domestic demand and ongoing tariff pressures.
These stimulus efforts appear to be taking effect. Chinese retail savers are increasingly moving funds out of traditional bank deposits and into the stock market. This trend reflects plummeting yields on bank accounts and equity markets hitting four-year highs, making stocks a more attractive option for household wealth allocation.
While Chinese exports remain strong, driven by their weaker currency, a headwind to the rest of emerging markets and Japan is that when currencies strengthen considerably, they force exporters to cut their prices in local terms to keep the dollar prices steady (similar to Europe). Tariffs aside, for example, the export price of passenger cars from Japan and South Korea is down more than 10% in domestic prices.
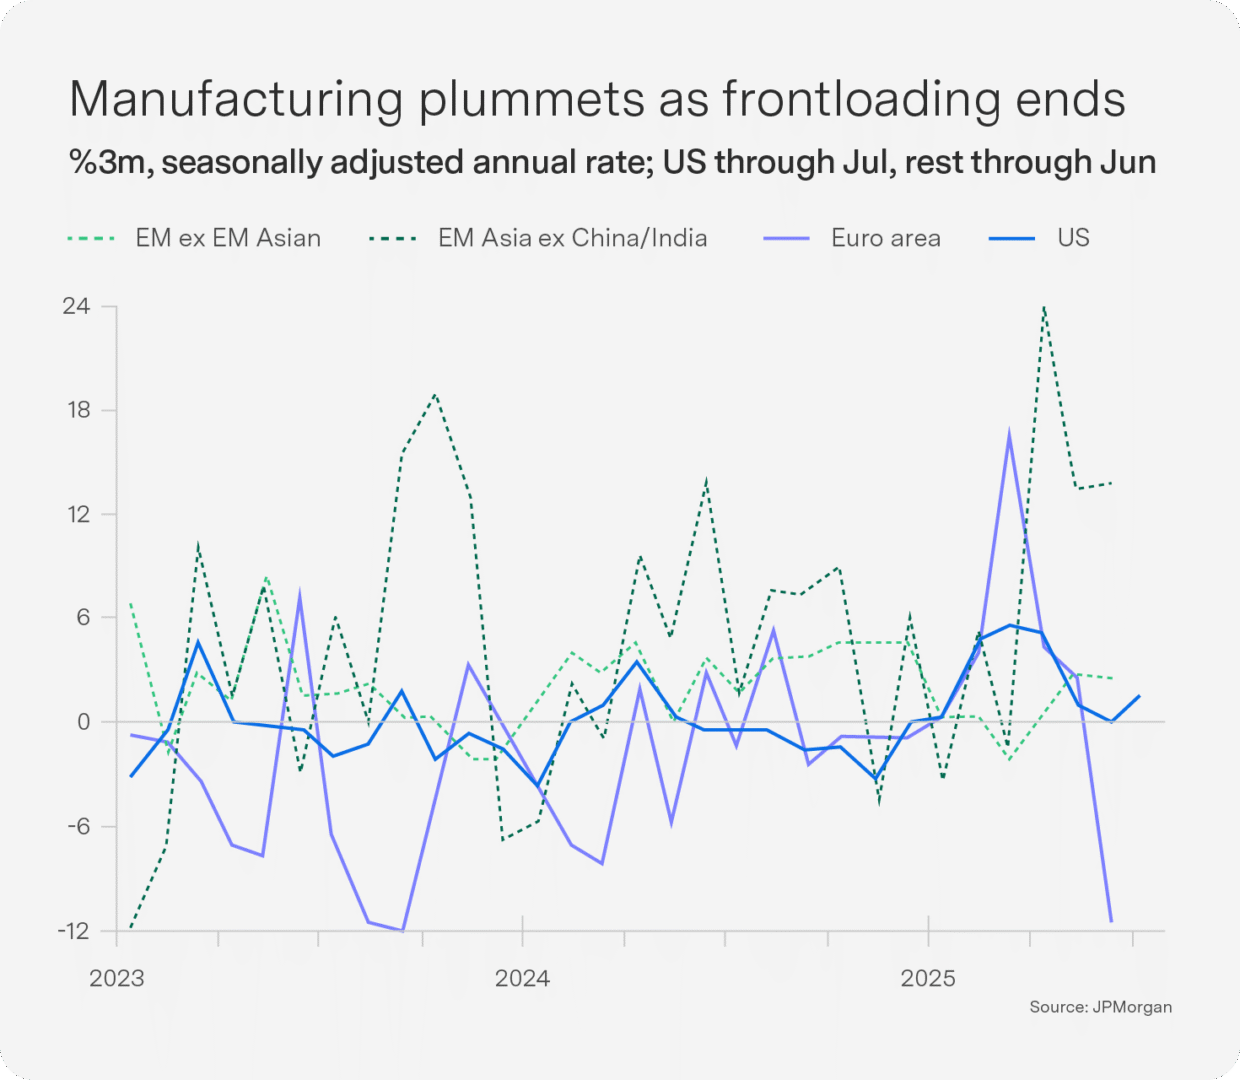
Outlook: Growth set to slow as frontloading slowdown takes hold

Global industrial production has begun to contract as the effects of frontloaded trade ahead of tariff implementation wear off. This slowdown has been particularly concentrated in the pharmaceutical sector and has disproportionately affected Europe. Manufacturing output in the euro area fell by 1.6% in June, contributing to an 11.4% decline in industrial production over the three months ending June. Meanwhile, emerging markets in Asia – excluding China and India – continue to benefit from sustained capital expenditure on technology. However, the start of new tariffs on 7 August, rising input costs and depressed business sentiment are expected to prolong weakness in manufacturing activity.
Inflation remains the primary driver shaping market dynamics in the US. Recent PPI data suggest that inflation could surprise to the upside, bolstering the US dollar and diminishing the likelihood of rate cuts. This environment poses challenges for equity markets, but – until inflation spikes materially – markets appear to favour a “Goldilocks” scenario, where growth slows sufficiently to moderate inflation without tipping the economy into recession.
The Fed is now expected to cut in September, seeing tariff inflation as transitory. We are not fighting the Fed and remain overweight equities and underweight the dollar, but we are monitoring US inflation and central bank policy as key market influencers in the weeks ahead.
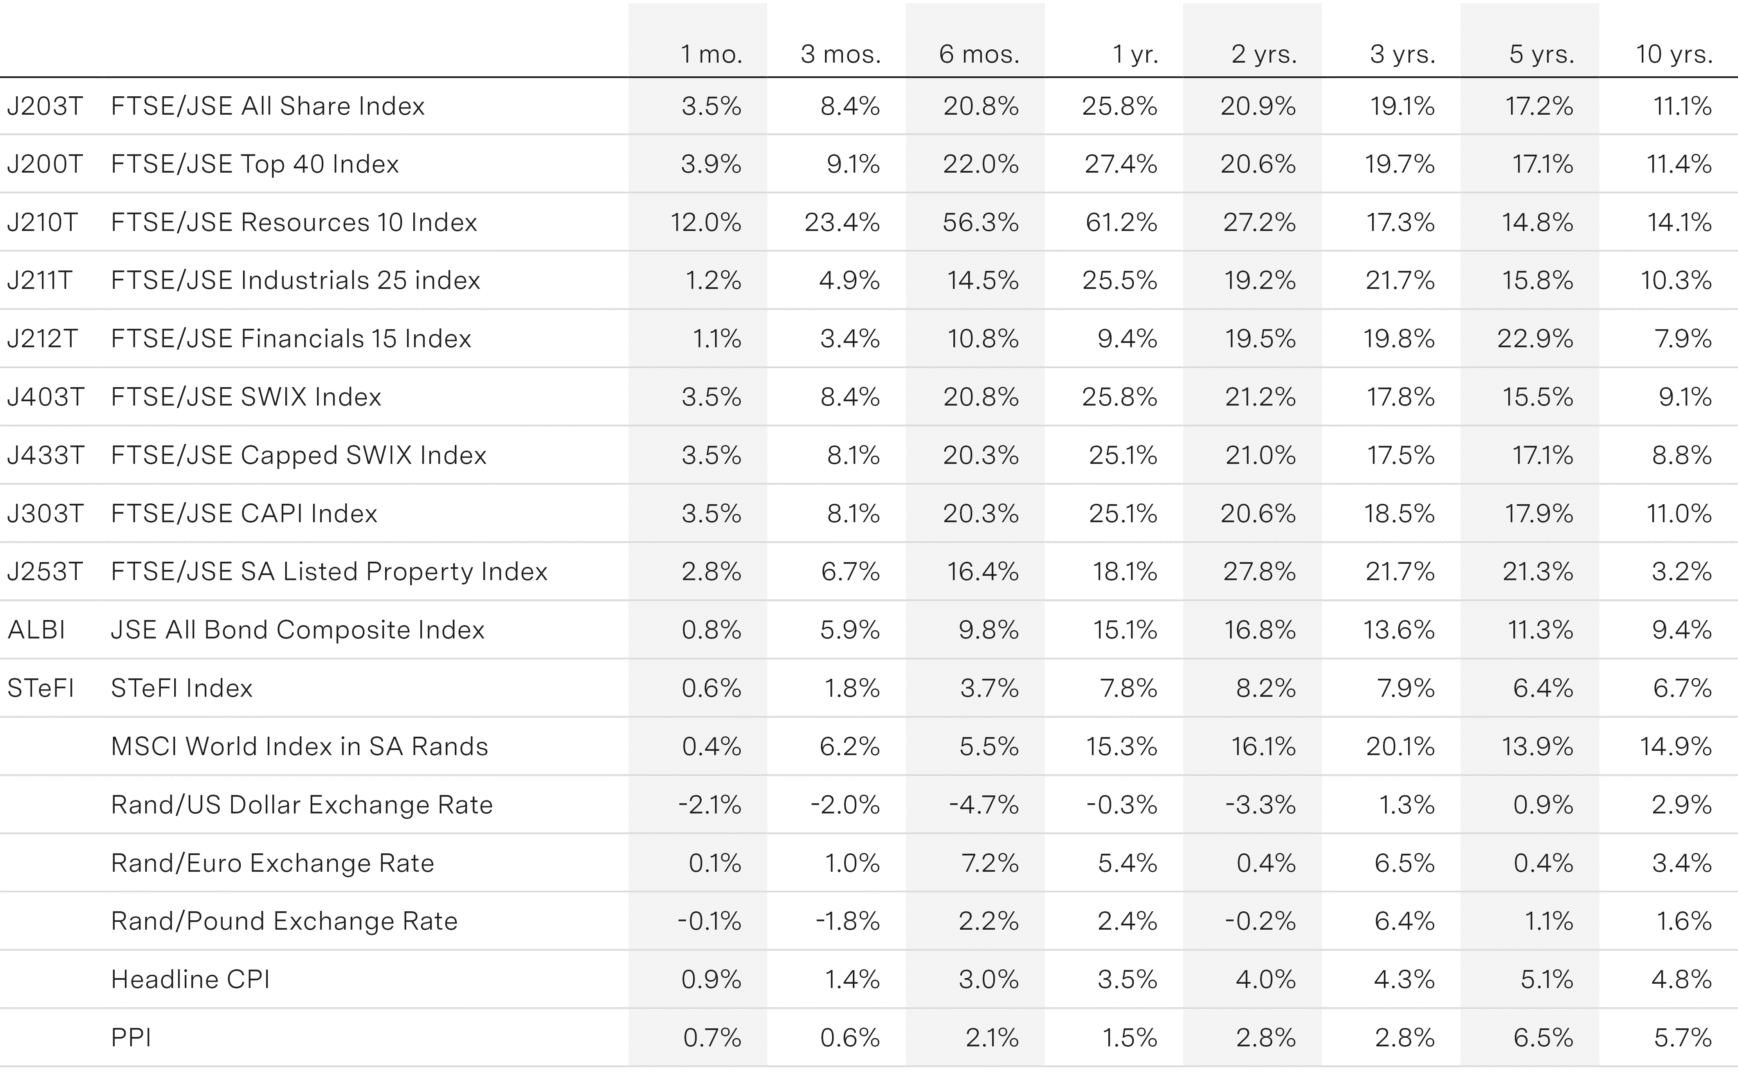
Key indicators